the data set represents the total number of people who bought bananas each hour at a grocery store. 1, 1, 5…
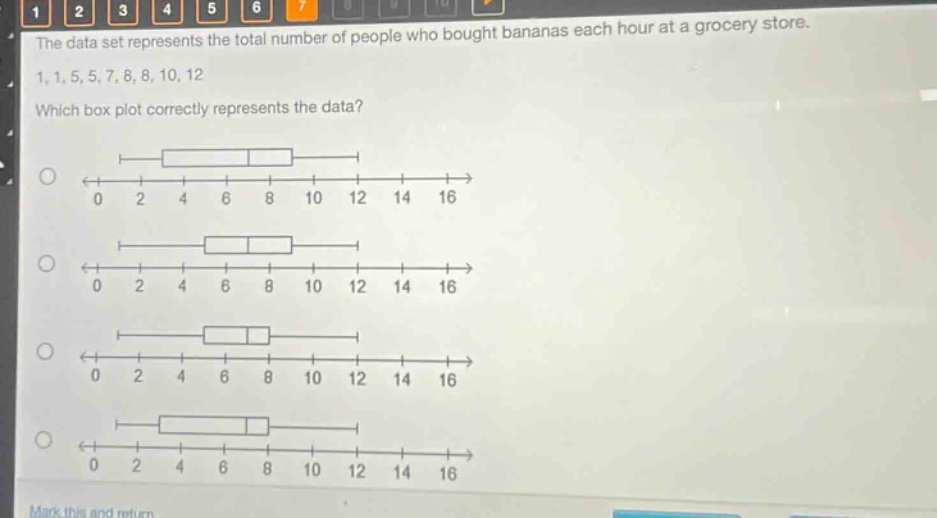
the data set represents the total number of people who bought bananas each hour at a grocery store. 1, 1, 5, 5, 7, 8, 8, 10, 12. which box - plot correctly represents the data?
Answer
Explanation:
Step1: Arrange data in order
The data set is already in ascending - order: 1, 1, 5, 5, 7, 8, 8, 10, 12.
Step2: Find the median (Q2)
There are 9 data points. The median is the 5th value. So, Q2 = 7.
Step3: Find the lower half of data
The lower - half data is 1, 1, 5, 5. The median of the lower - half (Q1) is $\frac{1 + 5}{2}=3$.
Step4: Find the upper half of data
The upper - half data is 8, 8, 10, 12. The median of the upper - half (Q3) is $\frac{8+10}{2}=9$.
Step5: Identify the minimum and maximum
The minimum value is 1 and the maximum value is 12.
The box - plot should have a box from Q1 = 3 to Q3 = 9 with a line at Q2 = 7 inside the box, and whiskers extending from 1 to 12.
Answer:
We need to visually check which of the given box - plots has a minimum at 1, Q1 at 3, Q2 at 7, Q3 at 9, and maximum at 12. Without the ability to label the options, we can't directly state which one it is, but you can use the above - calculated values to identify the correct box - plot.