the data set below represents the total number of touchdowns a quarterback threw each season for 10 seasons…
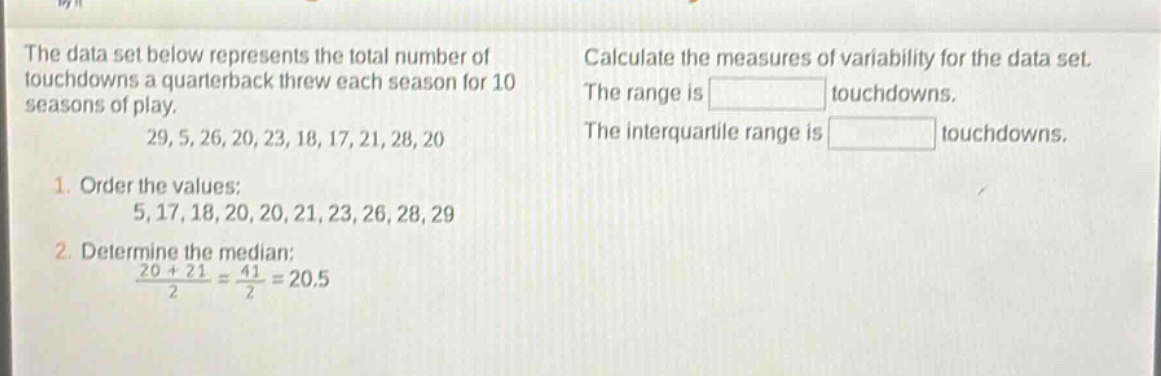
the data set below represents the total number of touchdowns a quarterback threw each season for 10 seasons of play. 29, 5, 26, 20, 23, 18, 17, 21, 28, 20. 1. order the values: 5, 17, 18, 20, 20, 21, 23, 26, 28, 29. 2. determine the median: $\frac{20 + 21}{2}=\frac{41}{2}=20.5$. calculate the measures of variability for the data set. the range is touchdowns. the interquartile range is touchdowns.
Answer
Explanation:
Step1: Calculate the range
The range is the difference between the maximum and minimum values. The maximum value in the ordered data - set (5,17,18,20,20,21,23,26,28,29) is (29) and the minimum value is (5). [29 - 5=24]
Step2: Calculate the first and third quartiles
The data - set has (n = 10) values. The median is the average of the 5th and 6th ordered values ((20) and (21)), so (M = 20.5). The lower half of the data - set is (5,17,18,20,20). The median of the lower half ((Q_1)) is the 3rd value, so (Q_1=18). The upper half of the data - set is (21,23,26,28,29). The median of the upper half ((Q_3)) is the 3rd value of the upper - half, so (Q_3 = 26). The inter - quartile range (IQR) is (Q_3−Q_1). [26 - 18 = 8]
Answer:
The range is (24) touchdowns. The interquartile range is (8) touchdowns.