the data set represents the total number of tuba players in each of 11 different school bands. 0, 1, 3, 3…
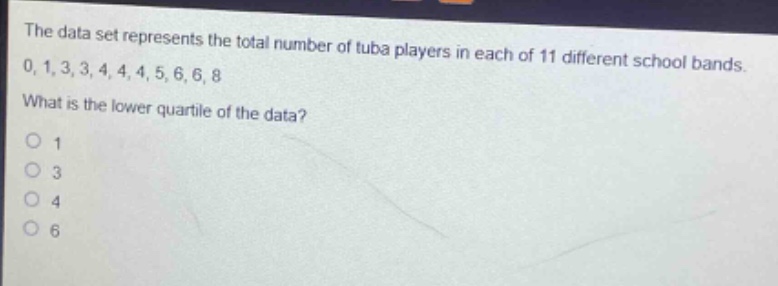
the data set represents the total number of tuba players in each of 11 different school bands. 0, 1, 3, 3, 4, 4, 4, 5, 6, 6, 8 what is the lower quartile of the data? 1 3 4 6
Answer
Explanation:
Step1: Arrange data in order
The data set is already in ascending - order: 0, 1, 3, 3, 4, 4, 4, 5, 6, 6, 8.
Step2: Calculate position of lower - quartile
The formula to find the position of the lower - quartile ($Q_1$) for a data set of size $n$ is $L=\frac{n + 1}{4}$. Here, $n = 11$. So, $L=\frac{11+1}{4}=\frac{12}{4}=3$.
Step3: Determine lower - quartile value
The position $L = 3$ means the lower - quartile is the 3rd value in the ordered data set. The 3rd value is 3.
Answer:
3