the data set shown below represents the number of times some families went out for dinner the previous week…
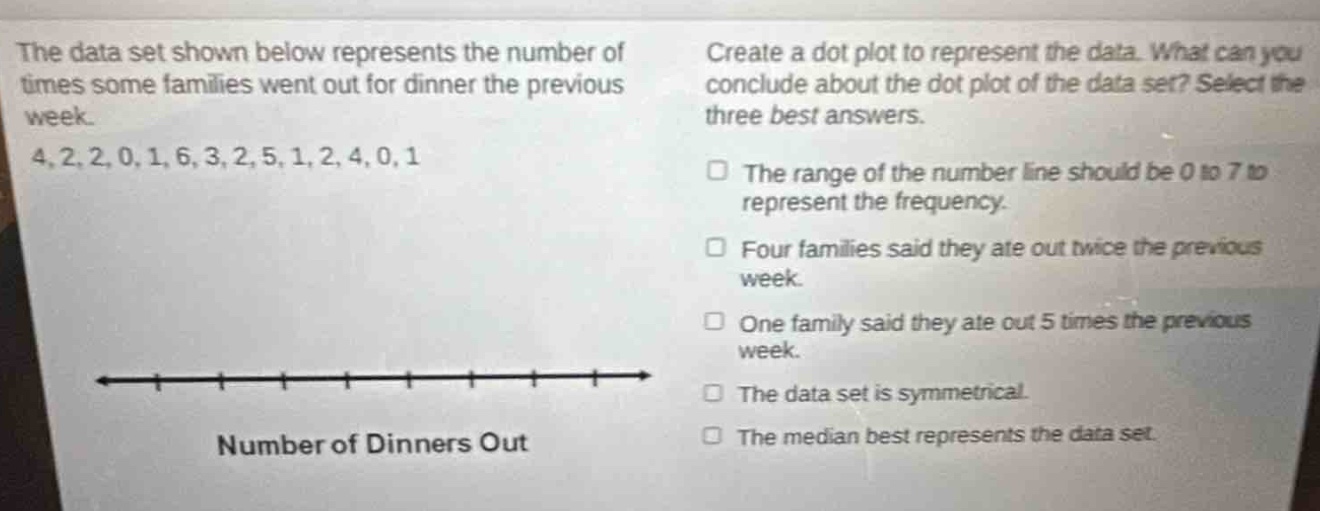
the data set shown below represents the number of times some families went out for dinner the previous week. 4, 2, 2, 0, 1, 6, 3, 2, 5, 1, 2, 4, 0, 1\ncreate a dot - plot to represent the data. what can you conclude about the dot plot of the data set? select the three best answers.\nthe range of the number line should be 0 to 7 to represent the frequency.\nfour families said they ate out twice the previous week.\none family said they ate out 5 times the previous week.\nthe data set is symmetrical.\nthe median best represents the data set.
Answer
Explanation:
Step1: Count frequencies
Count the number of times each value appears in the data - set 4, 2, 2, 0, 1, 6, 3, 2, 5, 1, 2, 4, 0, 1. 0 appears 2 times, 1 appears 4 times, 2 appears 4 times, 3 appears 1 time, 4 appears 2 times, 5 appears 1 time, 6 appears 1 time.
Step2: Analyze each statement
- For the range of the number - line: The values in the data - set range from 0 to 6. The range of the number line should be 0 to 6 to represent the number of dinners out, not 0 to 7 for frequency. So the first statement is false.
- For the number of families that ate out twice: Since 2 appears 4 times in the data - set, four families said they ate out twice the previous week. This statement is true.
- For the number of families that ate out 5 times: Since 5 appears 1 time in the data - set, one family said they ate out 5 times the previous week. This statement is true.
- For symmetry: The data - set is not symmetrical. The left - hand side (0, 1, 2) has more data points than the right - hand side (3, 4, 5, 6). So this statement is false.
- For the median: First, order the data set: 0, 0, 1, 1, 1, 1, 2, 2, 2, 2, 3, 4, 4, 5, 6. There are 15 data points. The median is the 8th value, which is 2. But the data has some outliers (5 and 6), and the mean might be affected by these outliers. However, the data is not symmetric, so the median is a good measure. This statement is true.
Answer:
Four families said they ate out twice the previous week. One family said they ate out 5 times the previous week. The median best represents the data set.