the data set shows the lengths of lizards in centimeters. data set 6.5 7 8.5 6 6 7 7 6.5 7 6 7.5 look at the…
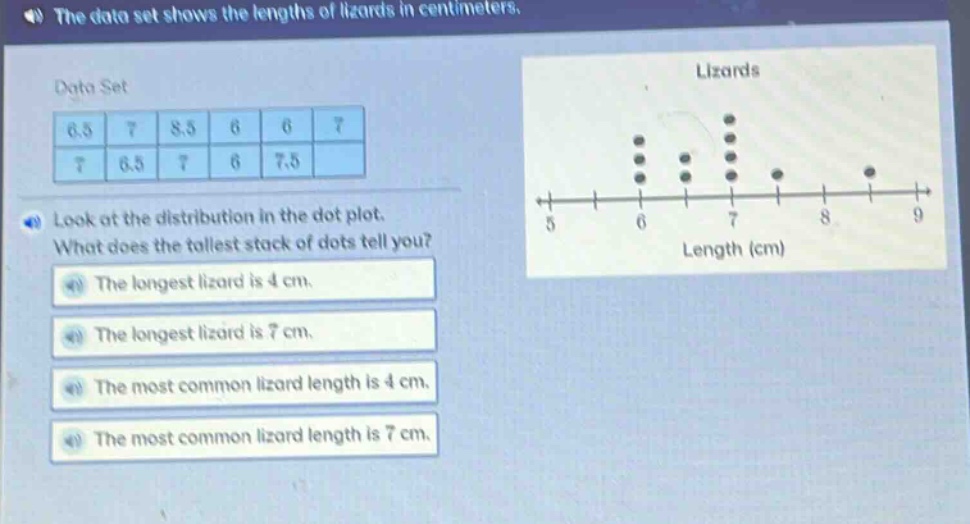
the data set shows the lengths of lizards in centimeters. data set 6.5 7 8.5 6 6 7 7 6.5 7 6 7.5 look at the distribution in the dot - plot. what does the tallest stack of dots tell you? the longest lizard is 4 cm. the longest lizard is 7 cm. the most common lizard length is 4 cm. the most common lizard length is 7 cm.
Answer
Explanation:
Step1: Understand dot - plot concept
In a dot - plot, the height of a stack of dots for a particular value represents the frequency of that value.
Step2: Analyze the given dot - plot
The tallest stack of dots is at the value 7 on the length axis. This means the length of 7 cm occurs most frequently among the lizards.
Answer:
The most common lizard length is 7 cm.