the data set shows the numbers of pages in the books on a reading list. 71, 96, 110, 112, 114, 114, 121…
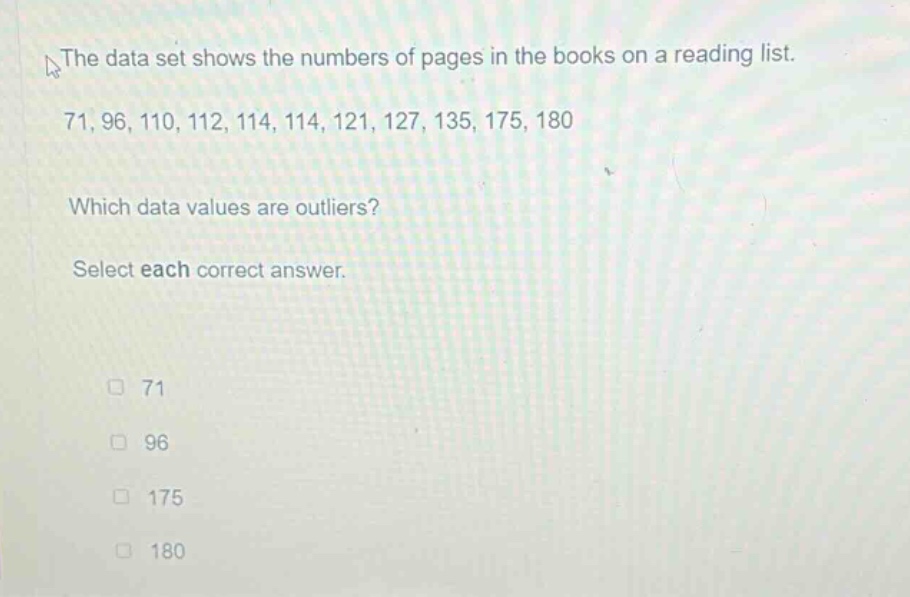
the data set shows the numbers of pages in the books on a reading list. 71, 96, 110, 112, 114, 114, 121, 127, 135, 175, 180 which data values are outliers? select each correct answer. 71 96 175 180
Answer
Explanation:
Step1: Arrange data in ascending order
71, 96, 110, 112, 114, 114, 121, 127, 135, 175, 180
Step2: Find median (Q2)
There are 11 data - points. The median is the 6th value, so Q2 = 114.
Step3: Find lower half and Q1
The lower half is 71, 96, 110, 112, 114. The median of the lower half (Q1) is 110.
Step4: Find upper half and Q3
The upper half is 121, 127, 135, 175, 180. The median of the upper half (Q3) is 135.
Step5: Calculate the inter - quartile range (IQR)
IQR=Q3 - Q1 = 135 - 110=25.
Step6: Calculate the lower and upper bounds for non - outliers
Lower bound = Q1−1.5×IQR = 110−1.5×25 = 110 - 37.5 = 72.5 Upper bound = Q3 + 1.5×IQR = 135+1.5×25 = 135 + 37.5 = 172.5
Step7: Identify outliers
Values less than 72.5 or greater than 172.5 are outliers. So 71, 175, 180 are outliers.
Answer:
71, 175, 180