the data set shows the weights of pears, in grams, in a crate of fruit. 143, 146, 158, 159, 162, 166, 169…
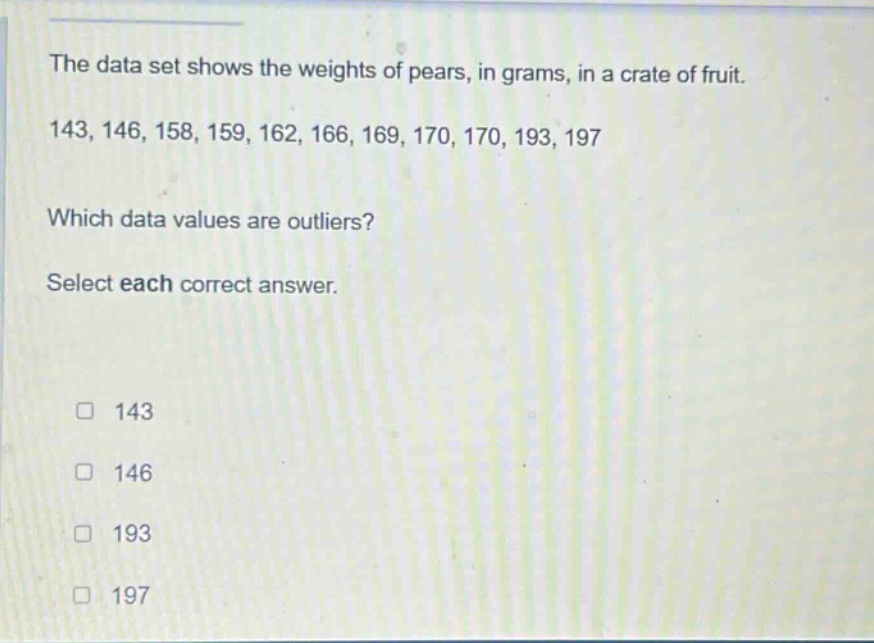
the data set shows the weights of pears, in grams, in a crate of fruit. 143, 146, 158, 159, 162, 166, 169, 170, 170, 193, 197 which data values are outliers? select each correct answer. 143 146 193 197
Answer
Explanation:
Step1: Arrange data in order
143, 146, 158, 159, 162, 166, 169, 170, 170, 193, 197
Step2: Find the median (Q2)
There are 11 data - points. The median is the 6th value, so Q2 = 166.
Step3: Find Q1 and Q3
The lower half of the data is 143, 146, 158, 159, 162. The median of the lower half (Q1) is 158. The upper half of the data is 169, 170, 170, 193, 197. The median of the upper half (Q3) is 170.
Step4: Calculate the inter - quartile range (IQR)
IQR=Q3 - Q1 = 170 - 158=12.
Step5: Determine the outlier boundaries
Lower boundary = Q1−1.5×IQR = 158−1.5×12 = 158 - 18 = 140. Upper boundary = Q3 + 1.5×IQR = 170+1.5×12 = 170 + 18 = 188.
Step6: Identify outliers
Values less than 140 or greater than 188 are outliers. 193 and 197 are greater than 188.
Answer:
193, 197