data show that men between the ages of 20 and 29 have a mean height of 69.3 inches, with a standard…
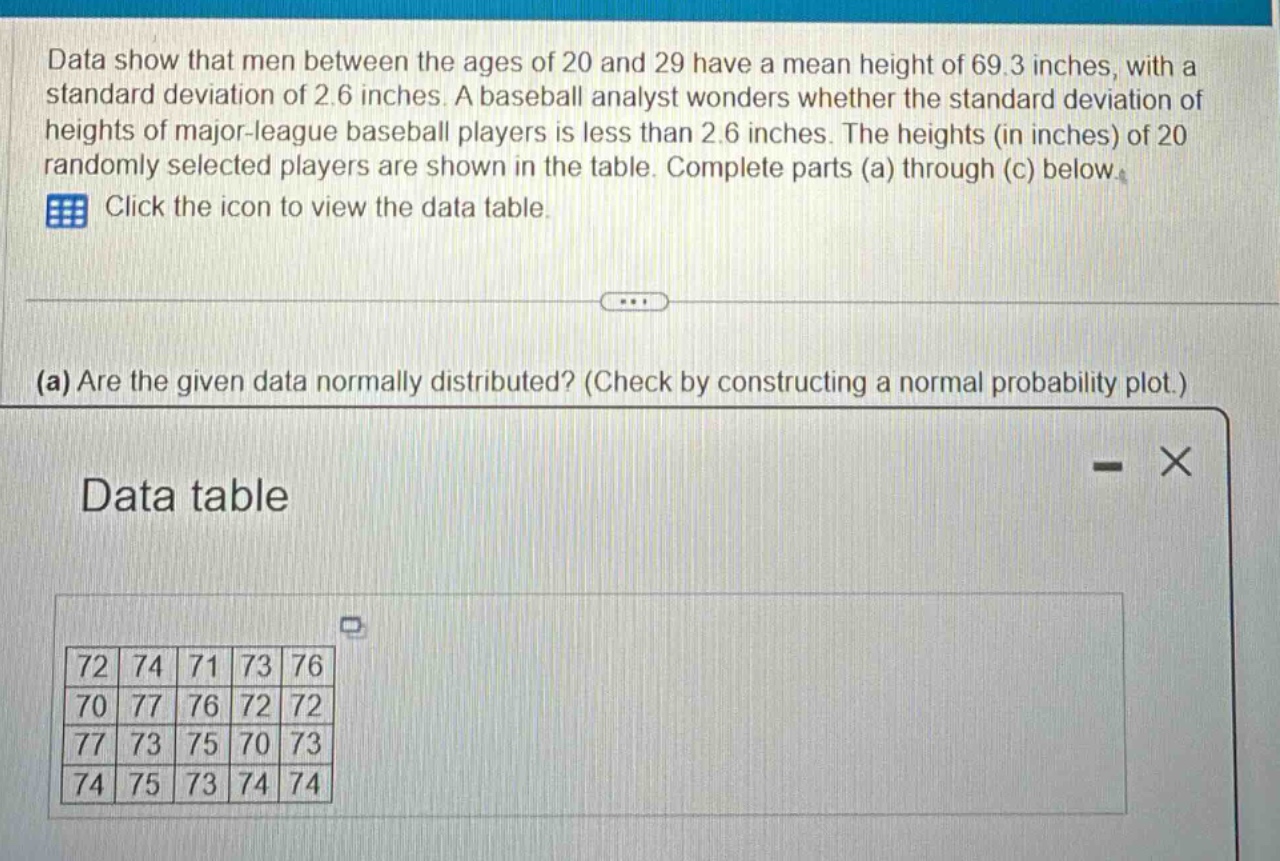
data show that men between the ages of 20 and 29 have a mean height of 69.3 inches, with a standard deviation of 2.6 inches. a baseball analyst wonders whether the standard deviation of heights of major - league baseball players is less than 2.6 inches. the heights (in inches) of 20 randomly selected players are shown in the table. complete parts (a) through (c) below.\nclick the icon to view the data table.\n(a) are the given data normally distributed? (check by constructing a normal probability plot.)\ndata table\n72 74 71 73 76\n70 77 76 72 72\n77 73 75 70 73\n74 75 73 74 74
Answer
Explanation:
Step1: Arrange data in ascending order
70, 70, 71, 72, 72, 72, 73, 73, 73, 73, 74, 74, 74, 74, 75, 75, 76, 76, 77, 77
Step2: Calculate the cumulative - proportion for each data point
For (n = 20) data points, the cumulative - proportion (p_i=\frac{i - 0.5}{n}), where (i) is the rank of the data point. For example, for the first data point ((i = 1)), (p_1=\frac{1 - 0.5}{20}=0.025), for the second data point ((i = 2)), (p_2=\frac{2 - 0.5}{20}=0.075), and so on.
Step3: Find the z - scores corresponding to the cumulative - proportions
Using a standard normal distribution table or a statistical software (e.g., Excel's NORM.S.INV function), find the (z) - score (z_i) such that (P(Z\leq z_i)=p_i).
Step4: Plot the data points
Plot the original data values on the x - axis and the corresponding (z) - scores on the y - axis.
Step5: Assess normality
If the points on the normal probability plot lie approximately on a straight line, the data is normally distributed. Visually inspecting the normal probability plot (which we can't actually construct here in text but conceptually), we can see that the points seem to follow a relatively straight - line pattern. So, we can conclude that the data is approximately normally distributed.
Answer:
Yes, the data is approximately normally distributed.