the data show the number of pieces of mail delivered to a single home address each day for three weeks. 4…
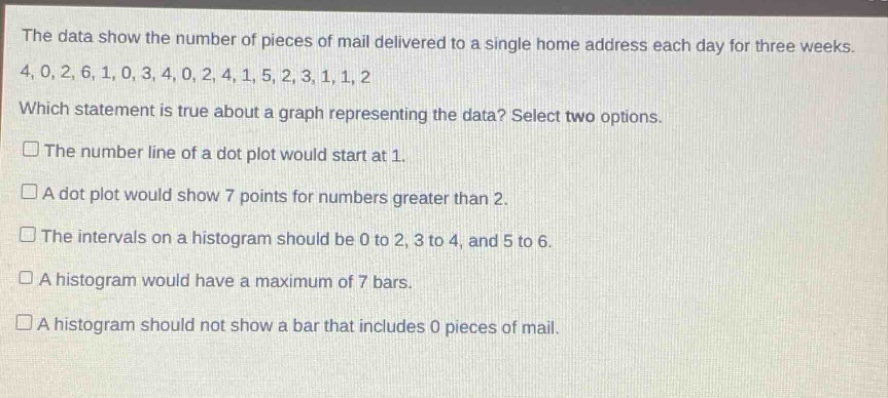
the data show the number of pieces of mail delivered to a single home address each day for three weeks. 4, 0, 2, 6, 1, 0, 3, 4, 0, 2, 4, 1, 5, 2, 3, 1, 1, 2 which statement is true about a graph representing the data? select two options. the number line of a dot plot would start at 1. a dot plot would show 7 points for numbers greater than 2. the intervals on a histogram should be 0 to 2, 3 to 4, and 5 to 6. a histogram would have a maximum of 7 bars. a histogram should not show a bar that includes 0 pieces of mail.
Answer
Answer:
B. A dot - plot would show 7 points for numbers greater than 2. C. The intervals on a histogram should be 0 to 2, 3 to 4, and 5 to 6.
Explanation:
Step1: Analyze dot - plot starting point
The data set has a 0, so the number line of a dot - plot should start at 0, not 1.
Step2: Count points greater than 2 in dot - plot
The numbers greater than 2 in the data set {4, 0, 2, 6, 1, 0, 3, 4, 0, 2, 4, 1, 5, 2, 3, 1, 1, 2} are 4, 6, 3, 4, 4, 5, 3. There are 7 such numbers, so a dot - plot would show 7 points for numbers greater than 2.
Step3: Determine histogram intervals
The values in the data set range from 0 to 6. Intervals of 0 - 2, 3 - 4, 5 - 6 are reasonable to group the data for a histogram.
Step4: Analyze number of histogram bars
The number of bars in a histogram depends on the intervals chosen. With the intervals 0 - 2, 3 - 4, 5 - 6, there are 3 bars, not 7.
Step5: Consider bar for 0 in histogram
Since 0 is in the data set, a histogram should show a bar that includes 0 pieces of mail.