the data below shows the number of baskets scored over the last 10 games for the ravens and the gators…
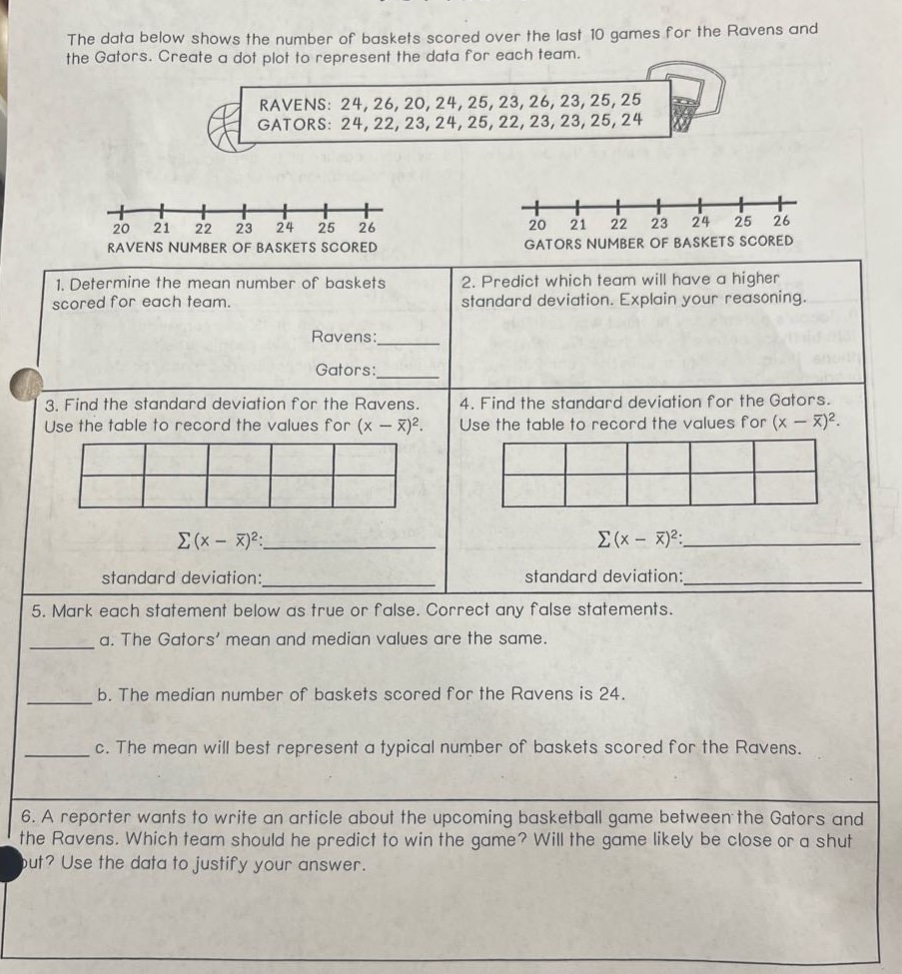
the data below shows the number of baskets scored over the last 10 games for the ravens and the gators. create a dot - plot to represent the data for each team. ravens: 24, 26, 20, 24, 25, 23, 26, 23, 25, 25 gators: 24, 22, 23, 24, 25, 22, 23, 23, 25, 24 1. determine the mean number of baskets scored for each team. ravens:____ gators:____ 2. predict which team will have a higher standard deviation. explain your reasoning. 3. find the standard deviation for the ravens. use the table to record the values for (x - x̄)². σ(x - x̄)²:____ standard deviation:____ 4. find the standard deviation for the gators. use the table to record the values for (x - x̄)². σ(x - x̄)²:____ standard deviation:____ 5. mark each statement below as true or false. correct any false statements. a. the gators’ mean and median values are the same. b. the median number of baskets scored for the ravens is 24. c. the mean will best represent a typical number of baskets scored for the ravens. 6. a reporter wants to write an article about the upcoming basketball game between the gators and the ravens. which team should he predict to win the game? will the game likely be close or a shut - out? use the data to justify your answer.
Answer
Explanation:
Step1: Calculate the mean for Ravens
The formula for the mean $\bar{x}=\frac{\sum_{i = 1}^{n}x_{i}}{n}$. For Ravens, $x_{1}=24,x_{2}=26,x_{3}=20,x_{4}=24,x_{5}=25,x_{6}=23,x_{7}=26,x_{8}=23,x_{9}=25,x_{10}=25$, and $n = 10$. $\sum_{i=1}^{10}x_{i}=24 + 26+20+24+25+23+26+23+25+25=241$. $\bar{x}_{Ravens}=\frac{241}{10}=24.1$.
Step2: Calculate the mean for Gators
For Gators, $x_{1}=24,x_{2}=22,x_{3}=23,x_{4}=24,x_{5}=25,x_{6}=22,x_{7}=23,x_{8}=23,x_{9}=25,x_{10}=24$, and $n = 10$. $\sum_{i = 1}^{10}x_{i}=24+22+23+24+25+22+23+23+25+24 = 235$. $\bar{x}_{Gators}=\frac{235}{10}=23.5$.
Step3: Predict higher - standard - deviation team
The data for Ravens has more spread out values (ranging from 20 - 26) compared to Gators (ranging from 22 - 25). So, the Ravens are likely to have a higher standard deviation.
Step4: Calculate standard deviation for Ravens
First, calculate $(x-\bar{x})^{2}$ for each value of $x$ in Ravens' data:
| $x$ | $x - \bar{x}_{Ravens}$ | $(x-\bar{x}_{Ravens})^{2}$ |
|---|---|---|
| 24 | $24 - 24.1=-0.1$ | $0.01$ |
| 26 | $26 - 24.1 = 1.9$ | $3.61$ |
| 20 | $20 - 24.1=-4.1$ | $16.81$ |
| 24 | $24 - 24.1=-0.1$ | $0.01$ |
| 25 | $25 - 24.1 = 0.9$ | $0.81$ |
| 23 | $23 - 24.1=-1.1$ | $1.21$ |
| 26 | $26 - 24.1 = 1.9$ | $3.61$ |
| 23 | $23 - 24.1=-1.1$ | $1.21$ |
| 25 | $25 - 24.1 = 0.9$ | $0.81$ |
| 25 | $25 - 24.1 = 0.9$ | $0.81$ |
| $\sum(x-\bar{x}_{Ravens})^{2}=0.01+3.61 + 16.81+0.01+0.81+1.21+3.61+1.21+0.81+0.81=28.9$. | ||
| The standard deviation $s_{Ravens}=\sqrt{\frac{\sum(x - \bar{x}_{Ravens})^{2}}{n-1}}=\sqrt{\frac{28.9}{9}}\approx1.79$. |
Step5: Calculate standard deviation for Gators
First, calculate $(x-\bar{x})^{2}$ for each value of $x$ in Gators' data:
| $x$ | $x - \bar{x}_{Gators}$ | $(x-\bar{x}_{Gators})^{2}$ |
|---|---|---|
| 24 | $24 - 23.5 = 0.5$ | $0.25$ |
| 22 | $22 - 23.5=-1.5$ | $2.25$ |
| 23 | $23 - 23.5=-0.5$ | $0.25$ |
| 24 | $24 - 23.5 = 0.5$ | $0.25$ |
| 25 | $25 - 23.5 = 1.5$ | $2.25$ |
| 22 | $22 - 23.5=-1.5$ | $2.25$ |
| 23 | $23 - 23.5=-0.5$ | $0.25$ |
| 23 | $23 - 23.5=-0.5$ | $0.25$ |
| 25 | $25 - 23.5 = 1.5$ | $2.25$ |
| 24 | $24 - 23.5 = 0.5$ | $0.25$ |
| $\sum(x-\bar{x}_{Gators})^{2}=0.25+2.25+0.25+0.25+2.25+2.25+0.25+0.25+2.25+0.25 = 12.5$. | ||
| The standard deviation $s_{Gators}=\sqrt{\frac{\sum(x - \bar{x}_{Gators})^{2}}{n - 1}}=\sqrt{\frac{12.5}{9}}\approx1.18$. |
Step6: Check statements
a.
For Gators, arrange data in ascending order: 22, 22, 23, 23, 23, 24, 24, 24, 25, 25. The median is $\frac{23 + 24}{2}=23.5$, and the mean is 23.5. So, this statement is True.
b.
For Ravens, arrange data in ascending order: 20, 23, 23, 24, 24, 25, 25, 25, 26, 26. The median is $\frac{24+25}{2}=24.5$. So, this statement is False.
c.
The data for Ravens has a relatively small spread around the mean, and there are no extreme outliers. So, the mean will best represent a typical number of baskets scored for the Ravens. This statement is True.
Step7: Predict the winner
The Ravens have a higher mean ($24.1$) compared to the Gators ($23.5$). Also, the standard - deviation of Ravens ($\approx1.79$) is higher than that of Gators ($\approx1.18$), which means Ravens' performance is more variable. The game is likely to be close since the difference in means is not very large.
Answer:
- Ravens: 24.1, Gators: 23.5
- Ravens, because their data has a wider range.
- $\sum(x-\bar{x})^{2}=28.9$, standard deviation $\approx1.79$
- $\sum(x-\bar{x})^{2}=12.5$, standard deviation $\approx1.18$
- a. True b. False, the median is 24.5 c. True
- Predict the Ravens to win. The game is likely to be close as the difference in means is small.