the data in the table compares x, the number of pages in a chapter, to y, the amount of time, in minutes…
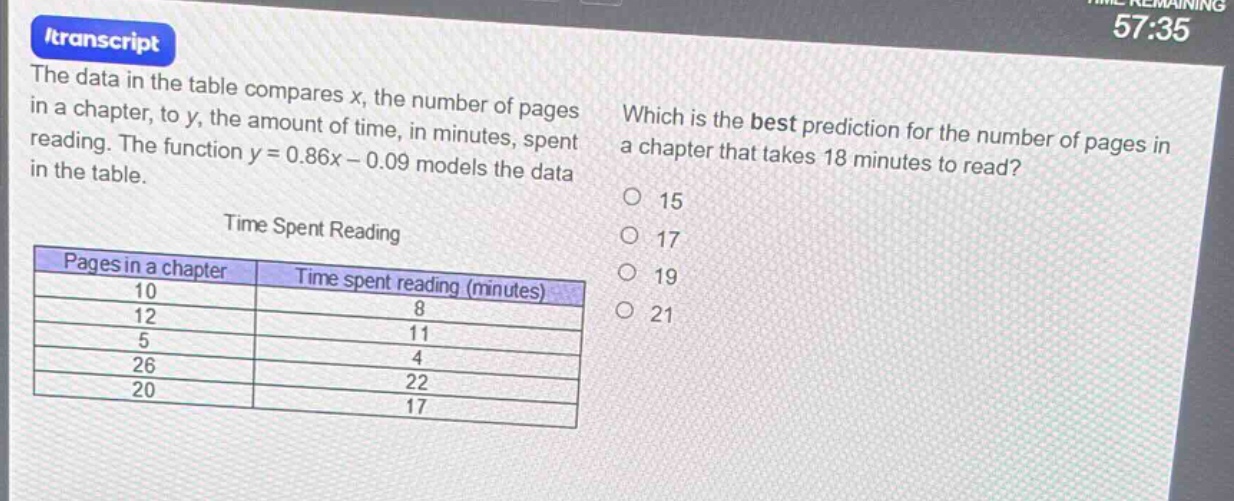
the data in the table compares x, the number of pages in a chapter, to y, the amount of time, in minutes, spent reading. the function y = 0.86x - 0.09 models the data in the table.\n\ntime spent reading\n| pages in a chapter | time spent reading (minutes) |\n| ---- | ---- |\n| 10 | 8 |\n| 12 | 11 |\n| 5 | 4 |\n| 26 | 22 |\n| 20 | 17 |\n\nwhich is the best prediction for the number of pages in a chapter that takes 18 minutes to read?\no 15\no 17\no 19\no 21
Answer
Explanation:
Step1: Sustituir el valor de y
Dado la ecuación $y = 0.86x-0.09$ y $y = 18$, sustituimos $y$ en la ecuación: $18=0.86x - 0.09$
Step2: Despejar x
Sumamos 0.09 a ambos lados de la ecuación: $18 + 0.09=0.86x-0.09 + 0.09$ $18.09 = 0.86x$ Luego dividimos ambos lados por 0.86: $x=\frac{18.09}{0.86}\approx21$
Answer:
21