the data in the table and graph shows the relationship between the number of absences a student has in a…
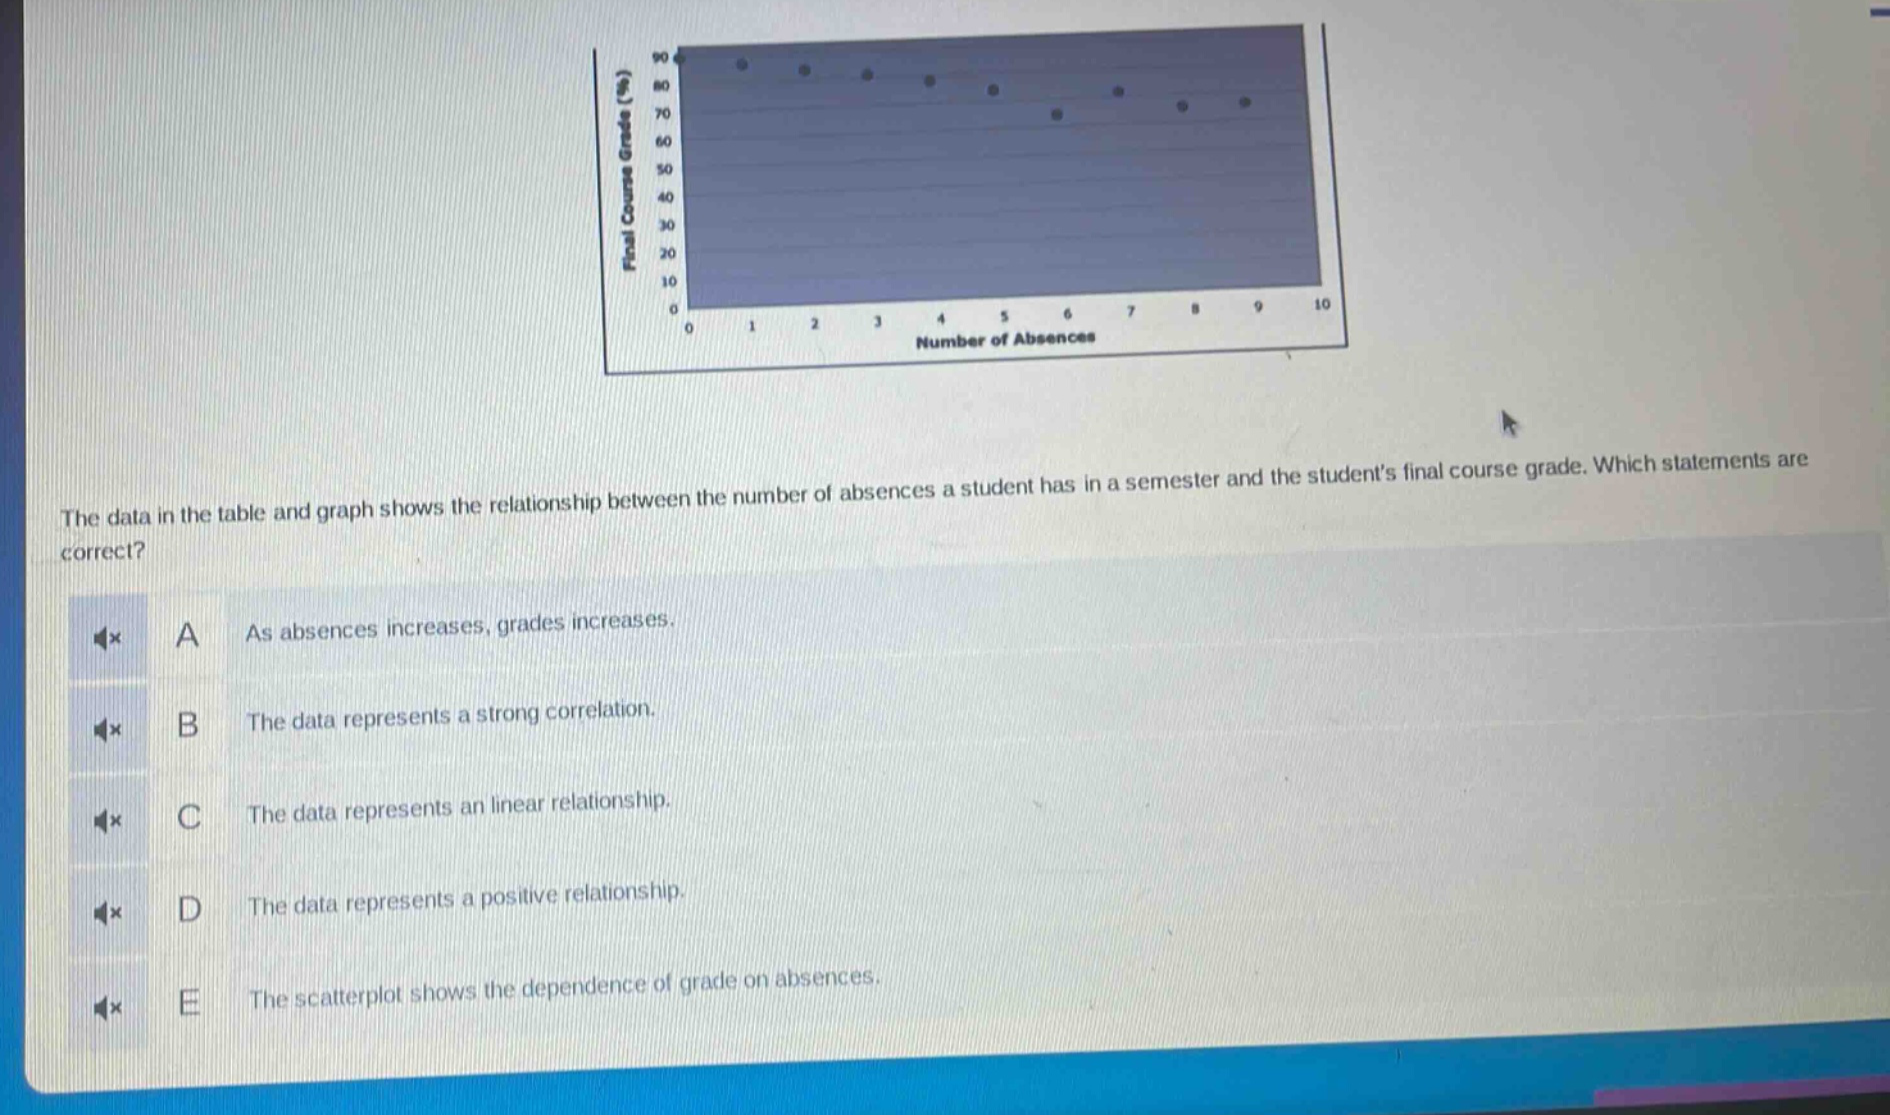
the data in the table and graph shows the relationship between the number of absences a student has in a semester and the students final course grade. which statements are correct? a as absences increases, grades increases. b the data represents a strong correlation. c the data represents an linear relationship. d the data represents a positive relationship. e the scatterplot shows the dependence of grade on absences.
Answer
Brief Explanations:
- Analyze the scatter - plot: As the number of absences increases, the final course grade generally decreases, so A and D are incorrect.
- The points in the scatter - plot seem to follow a somewhat linear pattern, indicating a linear relationship and strong correlation. Also, the plot shows how grade depends on absences.
Answer:
B. The data represents a strong correlation. C. The data represents an linear relationship. E. The scatterplot shows the dependence of grade on absences.