the data in the table represent the height of an object over time.\nheight of an object\n| time (seconds) |…
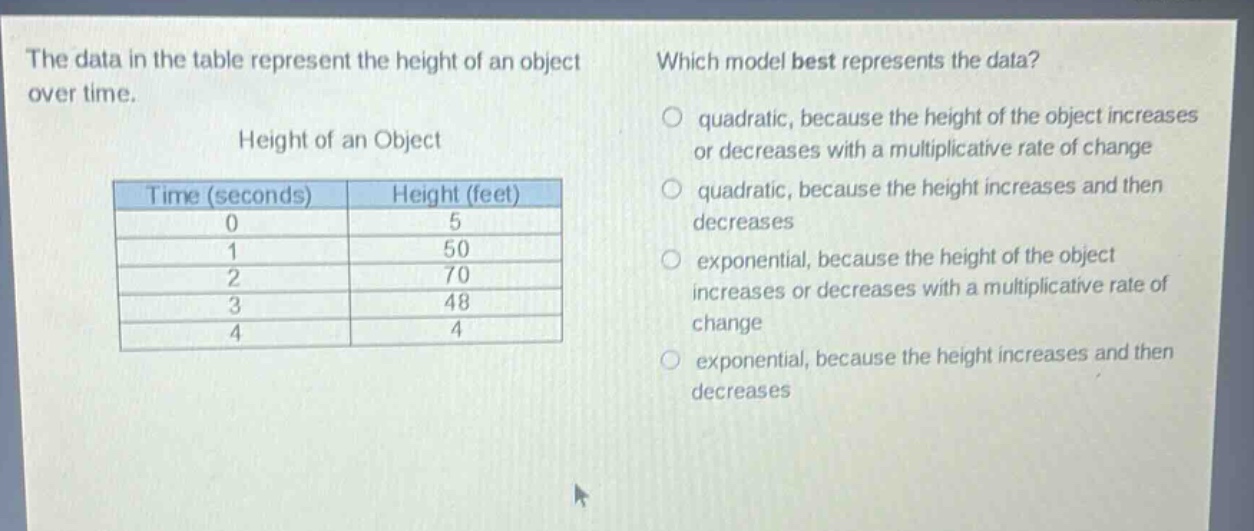
the data in the table represent the height of an object over time.\nheight of an object\n| time (seconds) | height (feet) |\n| ---- | ---- |\n| 0 | 5 |\n| 1 | 50 |\n| 2 | 70 |\n| 3 | 48 |\n| 4 | 4 |\nwhich model best represents the data?\n○ quadratic, because the height of the object increases or decreases with a multiplicative rate of change\n○ quadratic, because the height increases and then decreases\n○ exponential, because the height of the object increases or decreases with a multiplicative rate of change\n○ exponential, because the height increases and then decreases
Answer
Explanation:
Step1: Analyze height changes
Height increases to 70 at t=2, then decreases, showing a peak.
Step2: Compare model characteristics
Quadratic models have parabolic shape (increase then decrease). Exponential models require multiplicative rate (not observed here).
Answer:
quadratic, because the height increases and then decreases