the data in the table represent the height of an object over time.\nheight of an object\n| time (seconds) |…
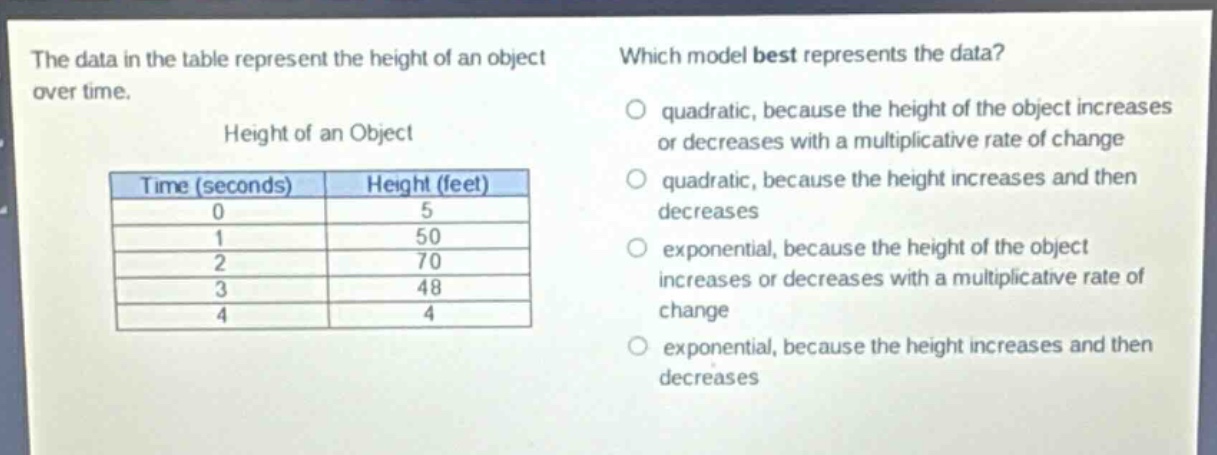
the data in the table represent the height of an object over time.\nheight of an object\n| time (seconds) | height (feet) |\n| ---- | ---- |\n| 0 | 5 |\n| 1 | 50 |\n| 2 | 70 |\n| 3 | 48 |\n| 4 | 4 |\nwhich model best represents the data?\no quadratic, because the height of the object increases or decreases with a multiplicative rate of change\no quadratic, because the height increases and then decreases\no exponential, because the height of the object increases or decreases with a multiplicative rate of change\no exponential, because the height increases and then decreases
Answer
Answer:
quadratic, because the height increases and then decreases
Explanation:
Step1: Analyze exponential model
Exponential models have a constant multiplicative rate - of - change and either grow or decay continuously. The height here first increases and then decreases, so it's not exponential.
Step2: Analyze quadratic model
Quadratic functions have a parabolic shape. They can increase and then decrease (or vice - versa). The height of the object in the table first goes up from 5 feet at time $t = 0$ to 70 feet at $t=2$ and then decreases to 4 feet at $t = 4$. This behavior is characteristic of a quadratic function.