the data in the table represent the height of an object over time. which model best represents the data…
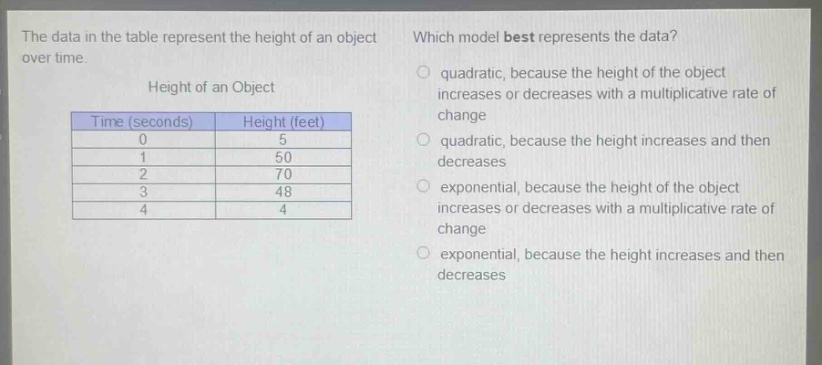
the data in the table represent the height of an object over time. which model best represents the data? height of an object\n| time (seconds) | height (feet) |\n| ---- | ---- |\n| 0 | 5 |\n| 1 | 50 |\n| 2 | 70 |\n| 3 | 48 |\n| 4 | 4 |\nquadratic, because the height of the object increases or decreases with a multiplicative rate of change\nquadratic, because the height increases and then decreases\nexponential, because the height of the object increases or decreases with a multiplicative rate of change\nexponential, because the height increases and then decreases
Answer
Answer:
quadratic, because the height increases and then decreases
Explanation:
Step 1: Analyze the height trend from the table.
The height values are 5, 50, 70, 48, 4 feet at times 0, 1, 2, 3, 4 seconds respectively. The height increases from time 0 to time 2 (5 to 70) and then decreases from time 2 to time 4 (70 to 4).
Step 2: Evaluate the characteristics of quadratic functions.
Quadratic functions graph as parabolas. A parabola opening downwards increases to a maximum value and then decreases. This matches the observed trend in the data.
Step 3: Evaluate the characteristics of exponential functions.
Exponential functions either continuously increase or continuously decrease. They do not exhibit a pattern of increasing and then decreasing.
Step 4: Compare the data trend to the function types.
The data shows the height increasing and then decreasing. This pattern is characteristic of a quadratic function, not an exponential function. Therefore, a quadratic model best represents the data.