the data in the table represent the height of an object over time. which model best represents the data…
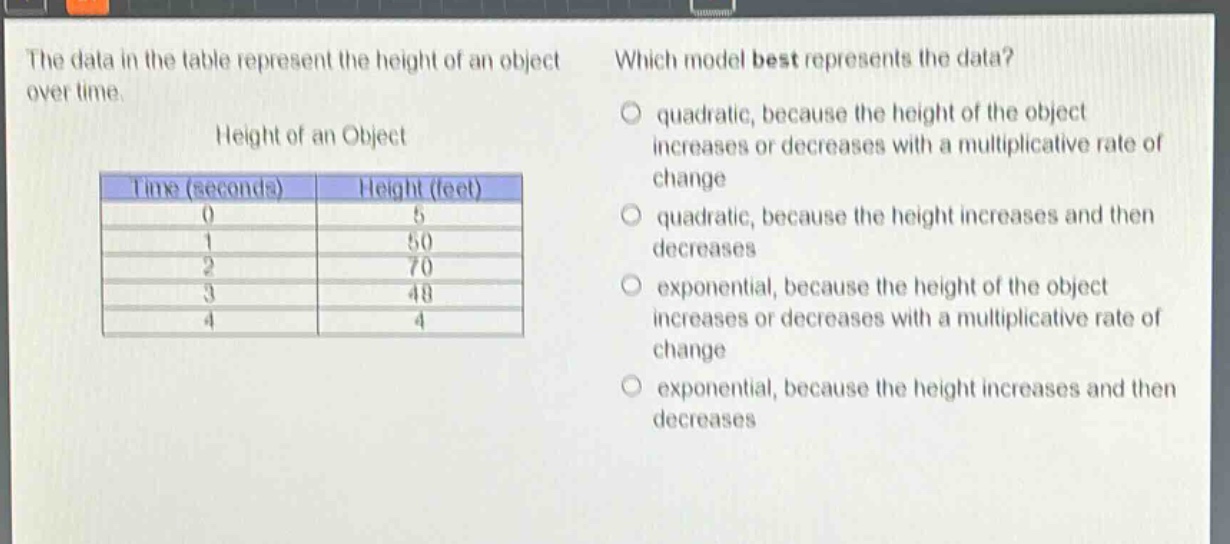
the data in the table represent the height of an object over time. which model best represents the data? height of an object time (seconds) height (feet) 0 5 1 50 2 70 3 48 4 4 quadratic, because the height of the object increases or decreases with a multiplicative rate of change quadratic, because the height increases and then decreases exponential, because the height of the object increases or decreases with a multiplicative rate of change exponential, because the height increases and then decreases
Answer
Answer:
B. quadratic, because the height increases and then decreases
Explanation:
Step1: Analyze exponential models
Exponential models have a multiplicative rate - of - change and either grow or decay continuously. The height here first increases and then decreases, so it's not an exponential model.
Step2: Analyze quadratic models
Quadratic functions have a parabolic shape. They can increase and then decrease (or vice - versa). Since the height of the object in the table first goes up from 5 feet at time (t = 0) to 70 feet at (t=2) and then goes down to 4 feet at (t = 4), a quadratic model best represents the data.