which data value would cause the interpretation of the data set to be understated?\n(20, 1)\n(55, 6)\n(90…
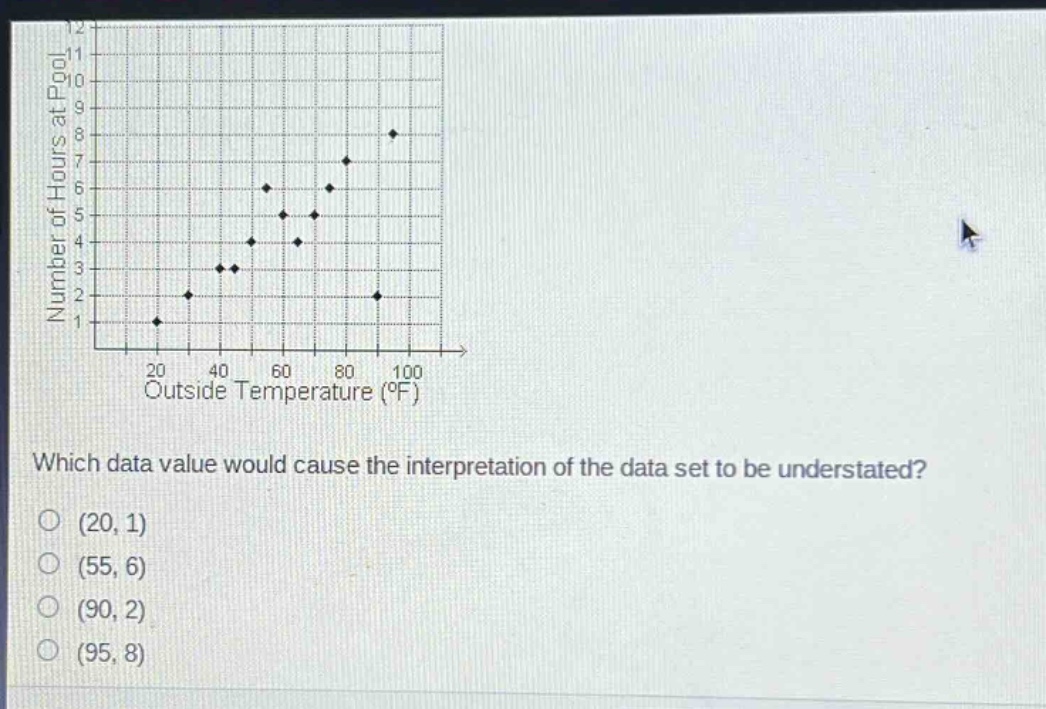
which data value would cause the interpretation of the data set to be understated?\n(20, 1)\n(55, 6)\n(90, 2)\n(95, 8)
Answer
Explanation:
Step1: Analyze the data trend
The general trend of the data points is that as the outside - temperature increases, the number of hours at the pool increases.
Step2: Check each option
For the point $(20,1)$, it is in line with the overall trend as at a low temperature, the number of hours is low. For $(55,6)$ and $(95,8)$, they also follow the upward - trend. But for the point $(90,2)$, when the temperature is high (90°F), the number of hours at the pool is very low compared to the general upward - trend of the data set. This point goes against the overall pattern and would cause the interpretation of the data set to be understated.
Answer:
$(90,2)$