each day last week, texs taco truck sold at least 175 tacos. on tuesday, tex sold more than 250 tacos even…
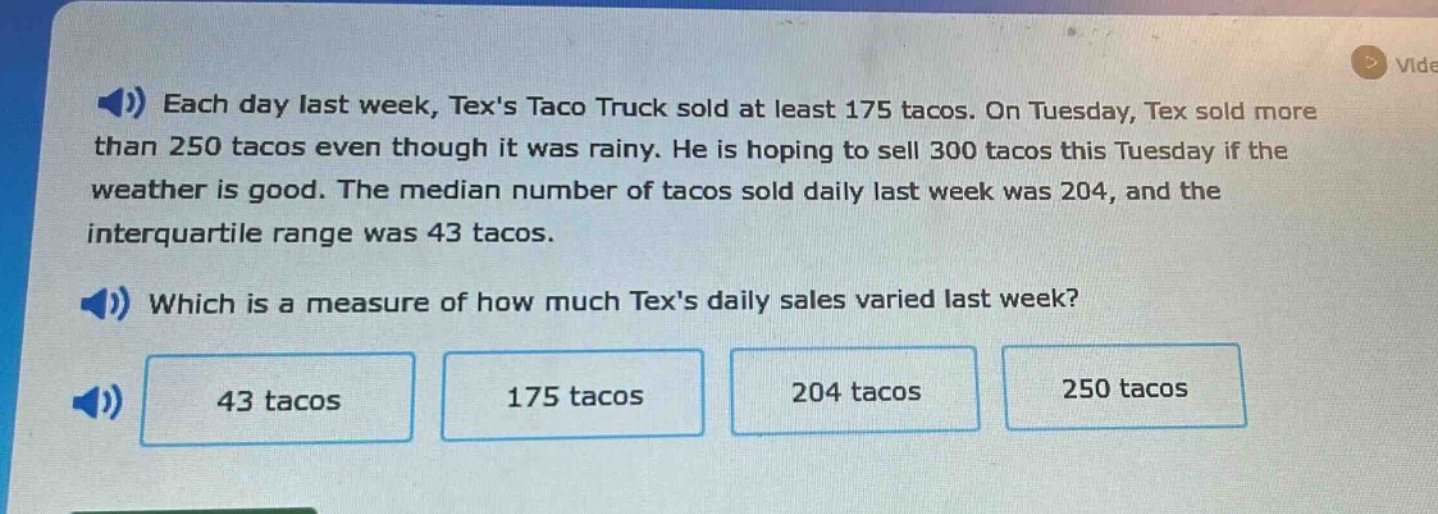
each day last week, texs taco truck sold at least 175 tacos. on tuesday, tex sold more than 250 tacos even though it was rainy. he is hoping to sell 300 tacos this tuesday if the weather is good. the median number of tacos sold daily last week was 204, and the interquartile range was 43 tacos. which is a measure of how much texs daily sales varied last week? 43 tacos 175 tacos 204 tacos 250 tacos
Answer
Explanation:
Step1: Recall the concept of interquartile range
The interquartile range (IQR) is a measure of statistical dispersion, which shows how much the data varies.
Step2: Analyze each option
- (175) tacos is the minimum number of tacos sold each day. It is not a measure of variation.
- (204) tacos is the median. The median is a measure of central tendency, not of variation.
- (250) tacos is just a value for a particular day. It is not a measure of overall variation.
- (43) tacos is the interquartile range. Since IQR is a measure of how much the data (in this case, daily taco - sales) varies.
Answer:
43 tacos