deb helped her little sister record the number of badges she earned each month in her online reading…
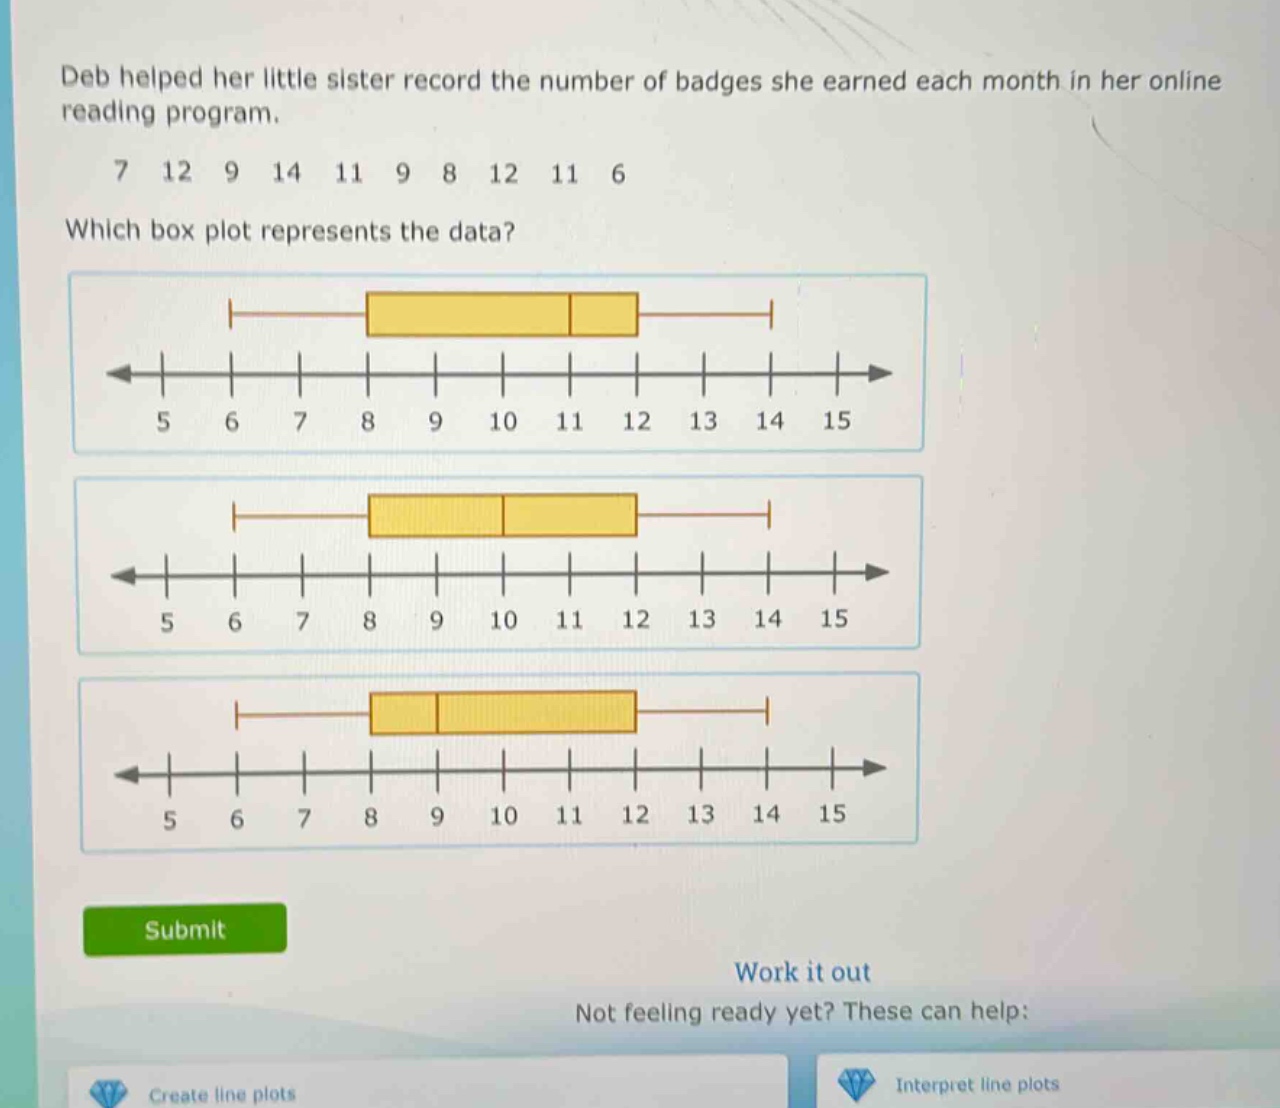
deb helped her little sister record the number of badges she earned each month in her online reading program.\n7 12 9 14 11 9 8 12 11 6\nwhich box plot represents the data?
Answer
Explanation:
Step1: Arrange data in ascending order
$6,7,8,9,9,11,11,12,12,14$
Step2: Find the median (Q2)
Since $n = 10$ (even), $Q2=\frac{9 + 11}{2}=10$
Step3: Find the lower - half data
$6,7,8,9,9$, and its median (Q1) is $8$
Step4: Find the upper - half data
$11,11,12,12,14$, and its median (Q3) is $12$
Step5: Identify the minimum and maximum
Minimum is $6$ and maximum is $14$
Answer:
The box - plot with the minimum at $6$, Q1 at $8$, Q2 at $10$, Q3 at $12$ and maximum at $14$ (you need to visually check which of the given box - plots match these values).