1. **define standard deviation:\nstandard deviation is a measure of how spread out a set of data is.\n2. the…
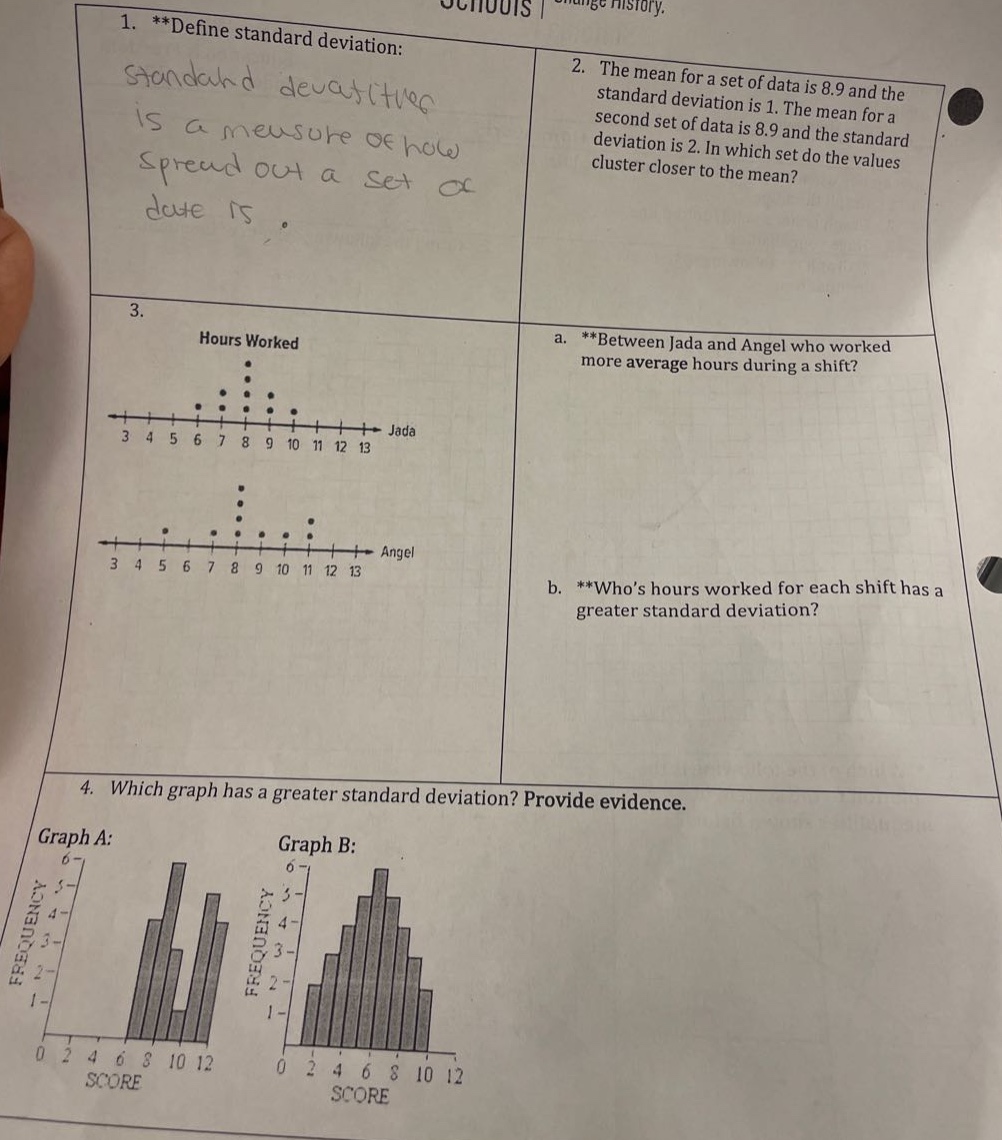
1. **define standard deviation:\nstandard deviation is a measure of how spread out a set of data is.\n2. the mean for a set of data is 8.9 and the standard deviation is 1. the mean for a second set of data is 8.9 and the standard deviation is 2. in which set do the values cluster closer to the mean?\n3.\nhours worked\njada\n3 4 5 6 7 8 9 10 11 12 13\nangel\n3 4 5 6 7 8 9 10 11 12 13\na. **between jada and angel who worked more average hours during a shift?\nb. **whos hours worked for each shift has a greater standard deviation?\n4. which graph has a greater standard deviation? provide evidence.\ngraph a:\nfrequency\n6-\n5-\n4-\n3-\n2-\n1-\n0 2 4 6 8 10 12\nscore\ngraph b:\nfrequency\n6-\n5-\n4-\n3-\n2-\n1-\n0 2 4 6 8 10 12\nscore
Answer
Explanation:
1. Define standard deviation
Standard deviation is a measure of the amount of variation or dispersion of a set of values. A low standard deviation indicates that the values tend to be close to the mean (also called the expected - value) of the set, while a high standard deviation indicates that the values are spread out over a wider range.
2. Compare data sets
The standard deviation measures the spread of data around the mean. A smaller standard deviation means the data values are closer to the mean. Given the first set has a standard deviation of 1 and the second set has a standard deviation of 2, with the same mean of 8.9, the values in the first set cluster closer to the mean.
3a. Find average hours
To find the average (mean) number of hours worked for Jada and Angel from the dot - plots: For Jada: Count the number of data points at each value. Let (x_i) be the number of hours and (f_i) be the frequency. The data points are: (x_1 = 6) with (f_1=1), (x_2 = 7) with (f_2 = 2), (x_3=8) with (f_3 = 5), (x_4 = 9) with (f_4=3), (x_5 = 10) with (f_5=2), (x_6=11) with (f_6 = 1) The mean (\bar{x}_J=\frac{6\times1 + 7\times2+8\times5 + 9\times3+10\times2+11\times1}{1 + 2+5+3+2+1}=\frac{6+14 + 40+27+20+11}{14}=\frac{118}{14}\approx8.43) For Angel: The data points are: (x_1 = 7) with (f_1=1), (x_2 = 8) with (f_2 = 3), (x_3=9) with (f_3 = 6), (x_4 = 10) with (f_4=3), (x_5 = 11) with (f_5=2) The mean (\bar{x}_A=\frac{7\times1+8\times3 + 9\times6+10\times3+11\times2}{1+3+6+3+2}=\frac{7+24+54+30+22}{15}=\frac{137}{15}\approx9.13) Angel worked more average hours.
3b. Compare standard deviations
Visually, the data for Jada is more spread out than the data for Angel. The values for Jada are more dispersed from the mean, so Jada's hours worked for each shift has a greater standard deviation.
4. Compare graphs
Standard deviation measures the spread of the data. In Graph A, the data is more spread out from the center (the bars are more spread out across the scores). In Graph B, the data is more concentrated around the center (the bars are more clustered around the middle scores). So Graph A has a greater standard deviation.
Answer:
- Standard deviation is a measure of the amount of variation or dispersion of a set of values.
- The first set (with standard deviation 1) has values that cluster closer to the mean. 3a. Angel worked more average hours. 3b. Jada's hours worked for each shift has a greater standard deviation.
- Graph A has a greater standard deviation because the data is more spread out across the scores compared to Graph B.