derek collects data on different brands of granola. for each brand, he finds the number of grams of fat in…
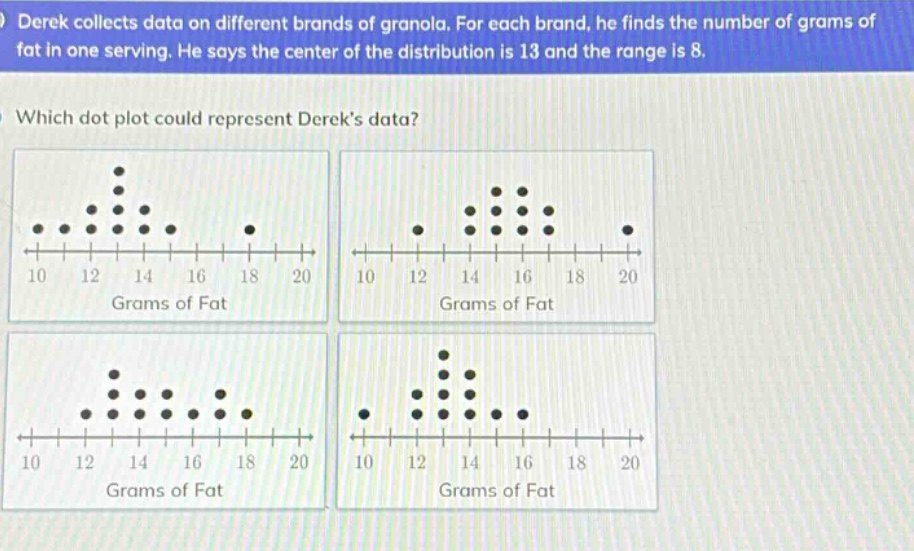
derek collects data on different brands of granola. for each brand, he finds the number of grams of fat in one serving. he says the center of the distribution is 13 and the range is 8. which dot - plot could represent dereks data?
Answer
Explanation:
Step1: Recall range formula
Range = Maximum - Minimum. Given range is 8.
Step2: Analyze each dot - plot
Check the maximum and minimum values in each dot - plot to see if range is 8 and center is around 13.
- For the first dot - plot: Minimum is 10, maximum is 18, range = 18 - 10=8. Center seems to be around 13.
- For the second dot - plot: Minimum is 12, maximum is 20, range = 20 - 12 = 8, but center is around 15.
- For the third dot - plot: Minimum is 12, maximum is 18, range = 18 - 12=6.
- For the fourth dot - plot: Minimum is 10, maximum is 18, range = 18 - 10 = 8, but center is around 14.
Answer:
The first dot - plot.