describe the association in the scatter plot below.\nanswer\nthe scatter plot shows association because as…
describe the association in the scatter plot below.\nanswer\nthe scatter plot shows association because as the plotted values of x increase, the values of y generally
Answer
Brief Explanations:
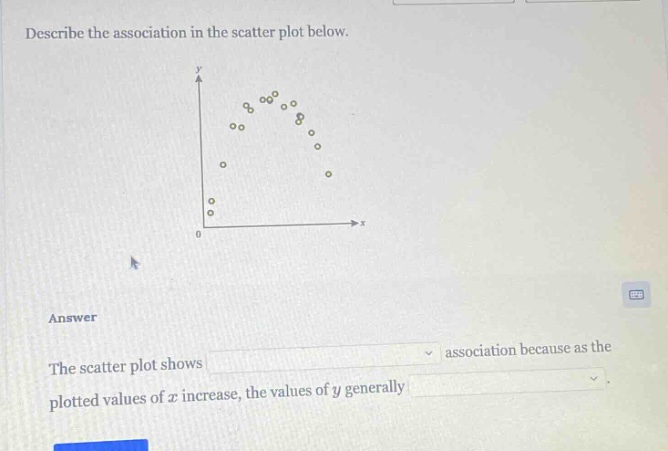
Examine the scatter - plot. As (x) values increase, (y) values first increase and then decrease. This is a non - linear pattern.
Answer:
The scatter plot shows a non - linear association because as the plotted values of (x) increase, the values of (y) generally first increase and then decrease.