describe the relationship. describe the relationship shown in the scatter plot. in particular, as ocean…
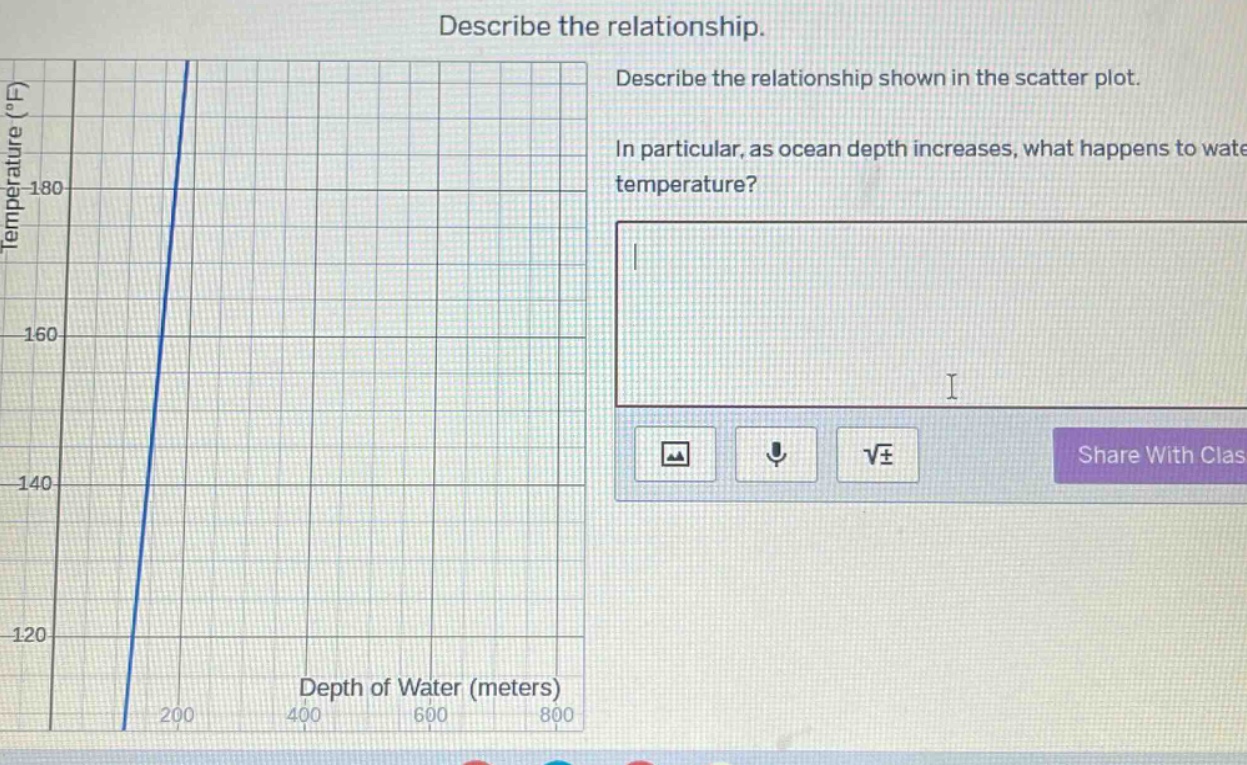
describe the relationship. describe the relationship shown in the scatter plot. in particular, as ocean depth increases, what happens to water temperature?
Answer
Brief Explanations:
By observing the scatter - plot, as the depth of water (x - axis) increases, the water temperature (y - axis) decreases. This indicates a negative linear relationship.
Answer:
As ocean depth increases, water temperature decreases, showing a negative linear relationship.