the descriptive statistics are shown.\nmeasure\tannual salary ($)\nmean\t39,500\nmedian\t20,000\nmode\t23,000…
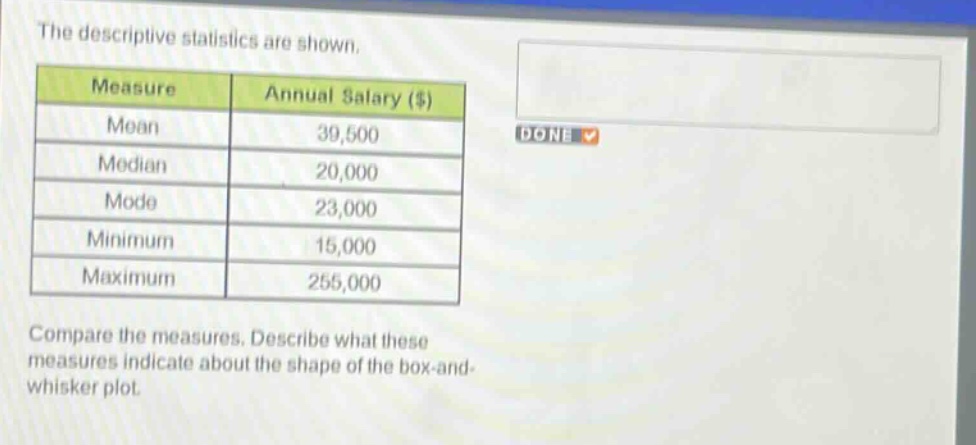
the descriptive statistics are shown.\nmeasure\tannual salary ($)\nmean\t39,500\nmedian\t20,000\nmode\t23,000\nminimum\t15,000\nmaximum\t255,000\ncompare the measures. describe what these measures indicate about the shape of the box - and - whisker plot.
Answer
Brief Explanations:
To understand the shape of the distribution and the corresponding box-and-whisker plot, we compare the measures of central tendency: the mean and the median. The mean annual salary is $39,500. The median annual salary is $20,000. Since the mean ($39,500) is significantly greater than the median ($20,000), the distribution of annual salaries is skewed to the right (positively skewed). This skewness is likely due to some very high salaries (like the maximum of $255,000) pulling the mean upwards. In a box-and-whisker plot, right skewness is typically indicated by the median being closer to the first quartile (lower end of the box) and/or the whisker extending to the maximum value being much longer than the whisker extending to the minimum value. The large difference between the median ($20,000) and the maximum ($255,000) compared to the difference between the minimum ($15,000) and the median ($20,000) supports this conclusion.
Answer:
The mean ($39,500) is greater than the median ($20,000). This indicates that the distribution of annual salaries is skewed to the right. A box-and-whisker plot representing this data would likely show a longer whisker on the right side, extending towards the maximum value, reflecting the presence of higher salaries that pull the mean higher than the median.