determine which correlation coefficient would most likely represent the relationship between the two…
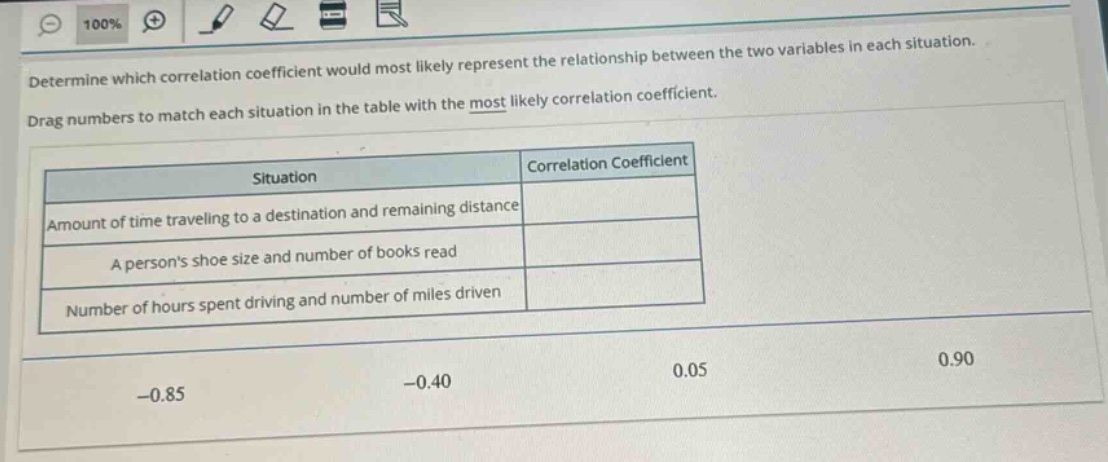
determine which correlation coefficient would most likely represent the relationship between the two variables in each situation. drag numbers to match each situation in the table with the most likely correlation coefficient.\n|situation|correlation coefficient|\n|--|--|\n|amount of time traveling to a destination and remaining distance| |\n|a persons shoe size and number of books read| |\n|number of hours spent driving and number of miles driven| |\n-0.85 -0.40 0.05 0.90
Answer
Answer:
- Amount of time traveling to a destination and remaining distance: -0.85
- A person's shoe size and number of books read: 0.05
- Number of hours spent driving and number of miles driven: 0.90
Explanation:
Step1: Analyze first situation
As time traveling increases, remaining distance decreases. Strong negative correlation, so -0.85.
Step2: Analyze second situation
Shoe - size and number of books read have no relation. Close to 0 correlation, so 0.05.
Step3: Analyze third situation
More hours driving means more miles driven. Strong positive correlation, so 0.90.