determine the distribution of the data pictured below\n\nuniform\nbell-shaped\nskewed-right\nskewed-left
determine the distribution of the data pictured below\n\nuniform\nbell-shaped\nskewed-right\nskewed-left
Answer
Brief Explanations:
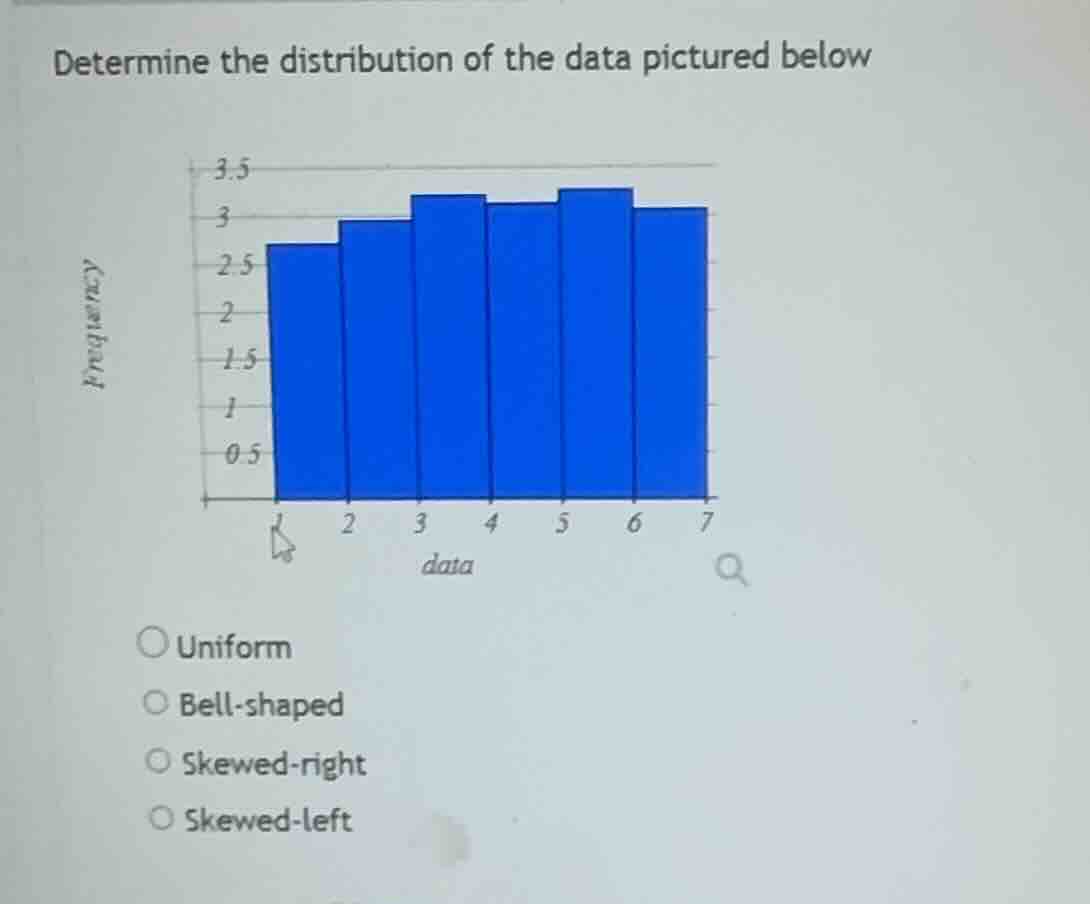
The provided histogram displays the frequency of data across several intervals. In a uniform distribution, the frequencies for all classes are approximately equal, resulting in a rectangular shape where the tops of the bars form a relatively flat line. Observing the image, the bars for the intervals 1-2, 2-3, 3-4, 4-5, 5-6, and 6-7 all have frequencies very close to each other (ranging roughly between 2.7 and 3.3). There is no distinct peak in the center (bell-shaped) nor a long tail to the left or right (skewed). Therefore, the data is best described as having a uniform distribution.
Answer:
Uniform