determine the type of correlation represented in the scatter plot below. answer attempt 1 out the graph…
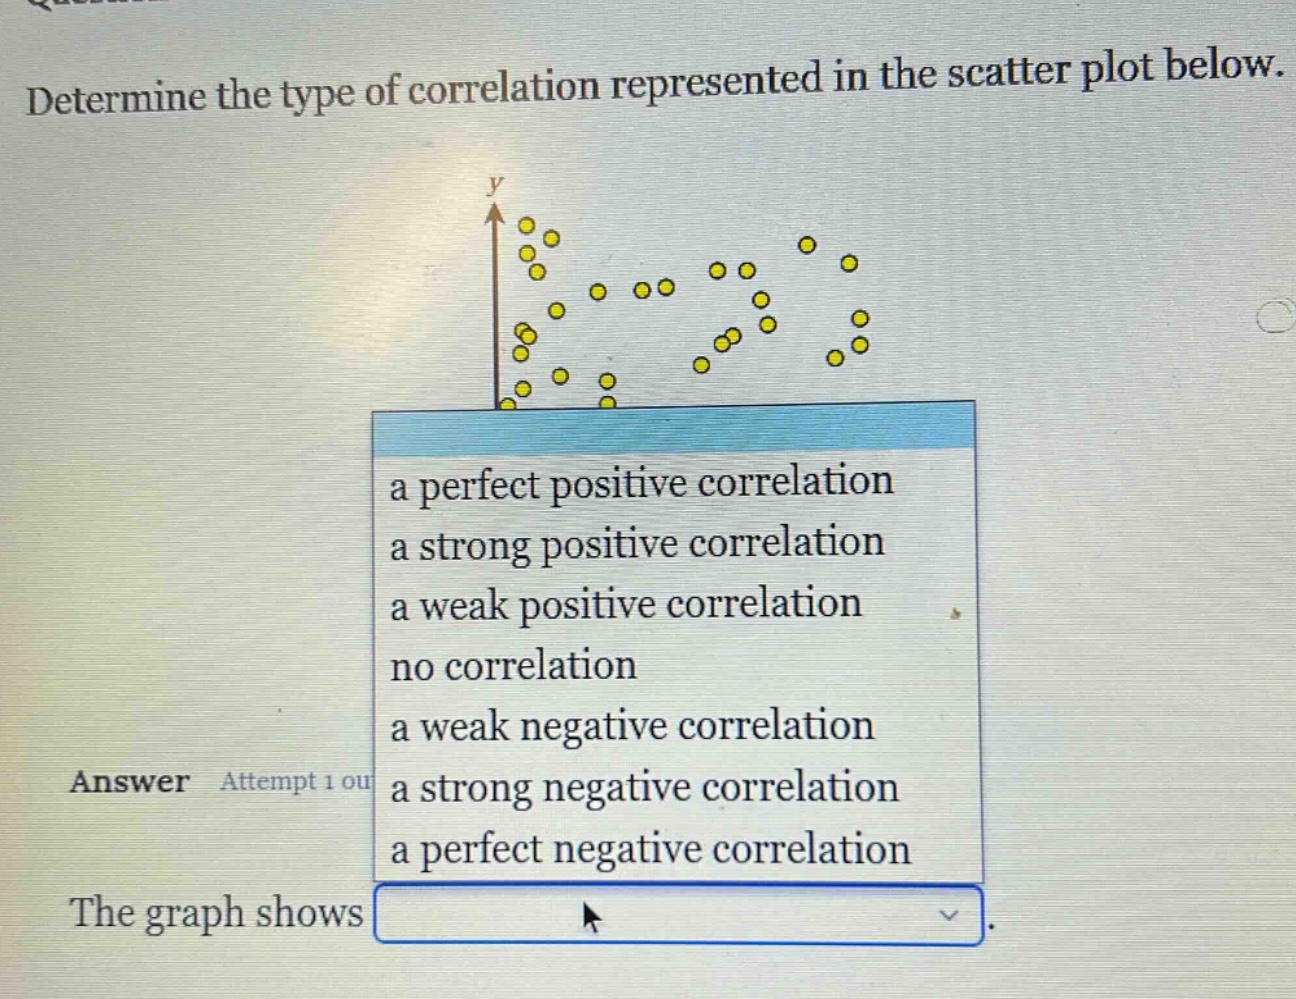
determine the type of correlation represented in the scatter plot below. answer attempt 1 out the graph shows a perfect positive correlation a strong positive correlation a weak positive correlation no correlation a weak negative correlation a strong negative correlation a perfect negative correlation
Answer
Brief Explanations:
In a scatter - plot, if the points are randomly scattered and do not show any upward or downward trend, there is no linear relationship between the two variables. Here, the points are randomly distributed and do not form any discernible pattern indicating a positive or negative linear relationship.
Answer:
no correlation