determine whether the data in the tables below represent exponential or logistic growth.\n| year |…
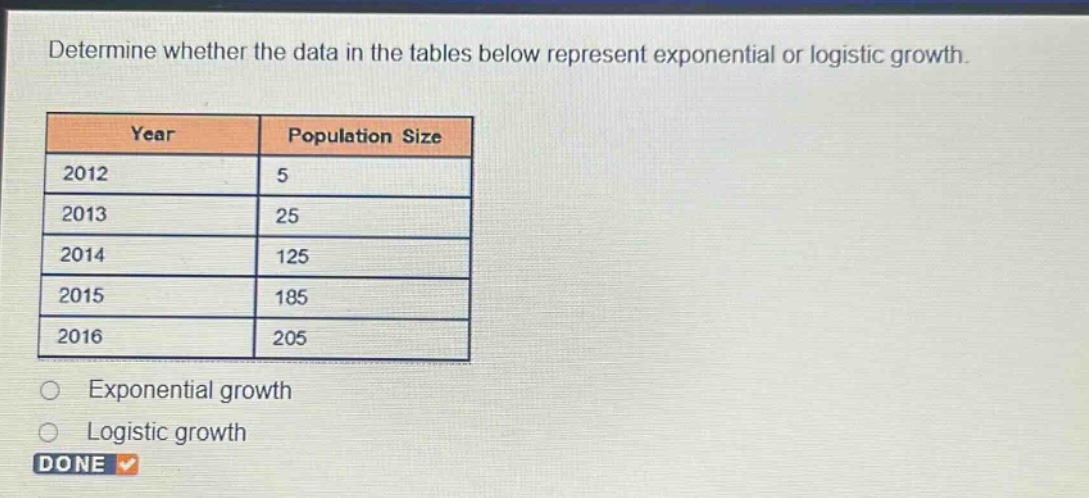
determine whether the data in the tables below represent exponential or logistic growth.\n| year | population size |\n| ---- | ---- |\n| 2012 | 5 |\n| 2013 | 25 |\n| 2014 | 125 |\n| 2015 | 185 |\n| 2016 | 205 |\nexponential growth\nlogistic growth
Answer
Answer:
Logistic growth
Explanation:
Step1: Analyze exponential growth
In exponential growth, the ratio of consecutive population - sizes should be constant. $\frac{25}{5}=5$, $\frac{125}{25} = 5$, but $\frac{185}{125}=1.48$ and $\frac{205}{185}\approx1.11$. The ratio is not constant.
Step2: Analyze logistic growth
In logistic growth, the population initially grows rapidly and then levels off as it approaches a carrying - capacity. Here, the population grows rapidly from 5 to 125 in the first few years and then the growth rate slows down (from 125 to 185 and then to 205), which is characteristic of logistic growth.