determine whether the following graph can represent a normal density function. could the graph represent a…
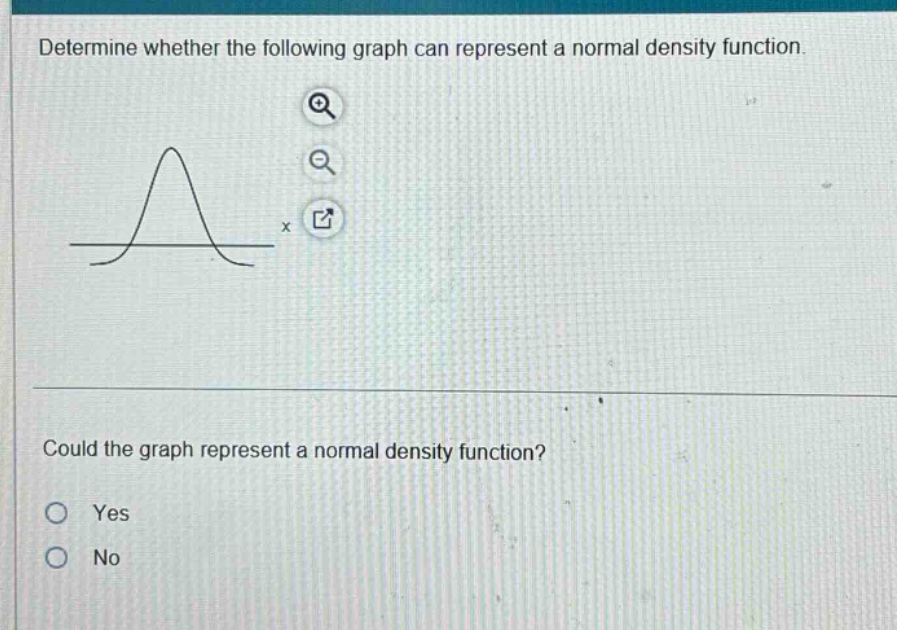
determine whether the following graph can represent a normal density function. could the graph represent a normal density function? yes no
Answer
Answer:
A. Yes
Explanation:
Step1: Recall normal - density properties
A normal density function is symmetric about its mean, is non - negative everywhere, and has a single peak.
Step2: Analyze the given graph
The given graph is symmetric about a vertical line, is non - negative for all values of (x), and has a single peak. So it satisfies the properties of a normal density function.