determining raw data values\nthe conditional relative frequency table was generated using data that compares…
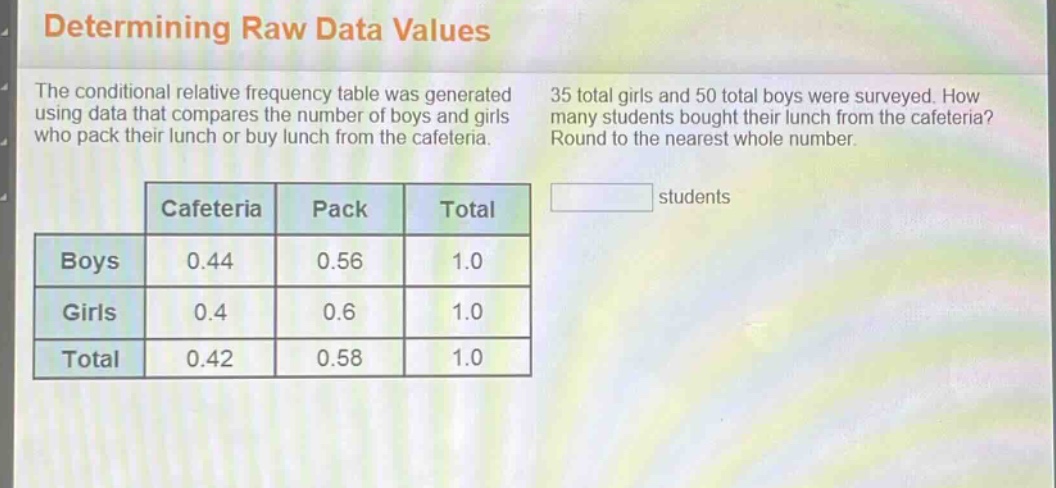
determining raw data values\nthe conditional relative frequency table was generated using data that compares the number of boys and girls who pack their lunch or buy lunch from the cafeteria. 35 total girls and 50 total boys were surveyed. how many students bought their lunch from the cafeteria? round to the nearest whole number.\n| |cafeteria|pack|total|\n|----|----|----|----|\n|boys|0.44|0.56|1.0|\n|girls|0.4|0.6|1.0|\n|total|0.42|0.58|1.0|\nstudents
Answer
Answer:
36
Explanation:
Step1: Calculate number of boys who bought lunch
Multiply total boys by cafeteria - relative - freq. $50\times0.44 = 22$
Step2: Calculate number of girls who bought lunch
Multiply total girls by cafeteria - relative - freq. $35\times0.4=14$
Step3: Calculate total students who bought lunch
Sum up boys and girls who bought lunch. $22 + 14=36$