x is a discrete random variable. the graph below defines a probability distribution for x. what is the…
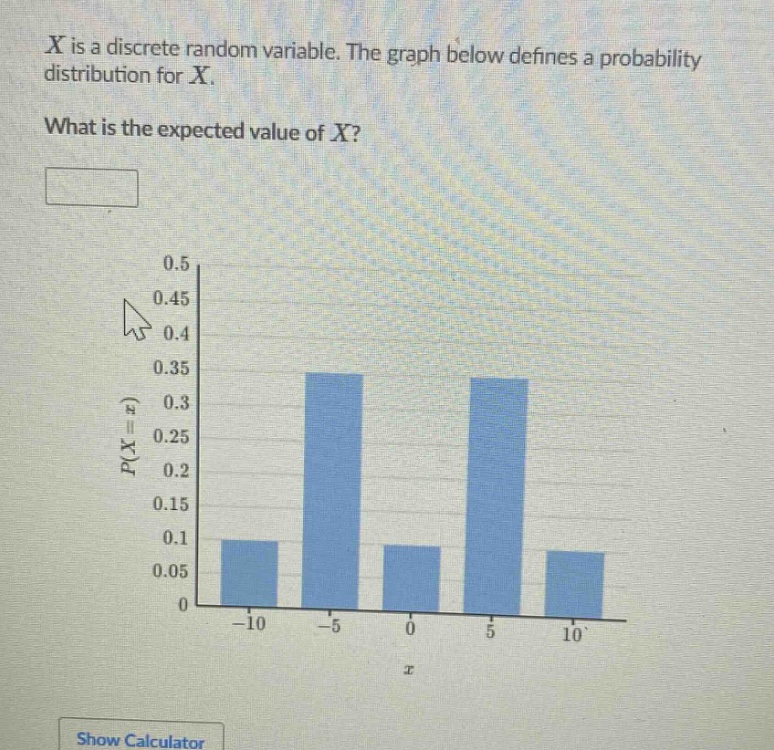
x is a discrete random variable. the graph below defines a probability distribution for x. what is the expected value of x?
Answer
Explanation:
Step1: Recall expected - value formula
The formula for the expected value $E(X)$ of a discrete random variable is $E(X)=\sum_{i}x_ip(x_i)$, where $x_i$ are the possible values of the random variable and $p(x_i)$ are their corresponding probabilities.
Step2: Identify values and probabilities
From the graph: When $x_1=- 10$, $p(x_1) = 0.1$; when $x_2=-5$, $p(x_2)=0.35$; when $x_3 = 0$, $p(x_3)=0.1$; when $x_4 = 5$, $p(x_4)=0.35$; when $x_5 = 10$, $p(x_5)=0.1$.
Step3: Calculate the product for each pair
For $x_1=-10$ and $p(x_1) = 0.1$, the product is $(-10)\times0.1=-1$. For $x_2=-5$ and $p(x_2)=0.35$, the product is $(-5)\times0.35=-1.75$. For $x_3 = 0$ and $p(x_3)=0.1$, the product is $0\times0.1 = 0$. For $x_4 = 5$ and $p(x_4)=0.35$, the product is $5\times0.35 = 1.75$. For $x_5 = 10$ and $p(x_5)=0.1$, the product is $10\times0.1 = 1$.
Step4: Sum up the products
$E(X)=-1-1.75 + 0+1.75 + 1$ $E(X)=0$
Answer:
$0$