the displays represent house prices in a town over two consecutive years. what do the displays tell you…
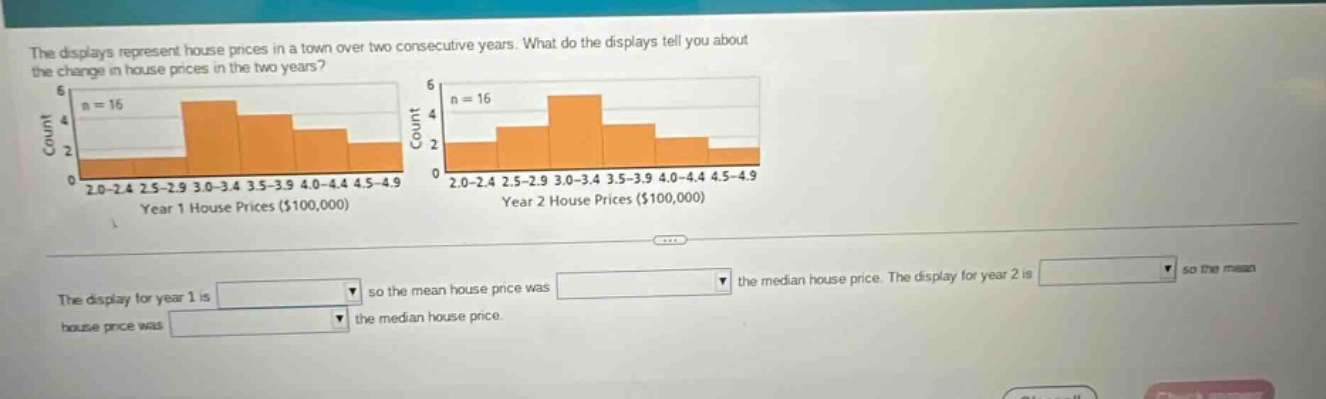
the displays represent house prices in a town over two consecutive years. what do the displays tell you about the change in house prices in the two years?\nthe display for year 1 is so the mean house price was the median house price. the display for year 2 is so the mean house price was the median house price.
Answer
Explanation:
Step1: Analyze Year 1 histogram
The Year 1 histogram is right - skewed. In a right - skewed distribution, the mean is pulled in the direction of the tail (higher values), so the mean house price was greater than the median house price.
Step2: Analyze Year 2 histogram
The Year 2 histogram is left - skewed. In a left - skewed distribution, the mean is pulled in the direction of the tail (lower values), so the mean house price was less than the median house price.
Answer:
The display for year 1 is right - skewed, so the mean house price was greater than the median house price. The display for year 2 is left - skewed, so the mean house price was less than the median house price.