doctors recorded the weight of newborn babies during july. which statement best describes the data…
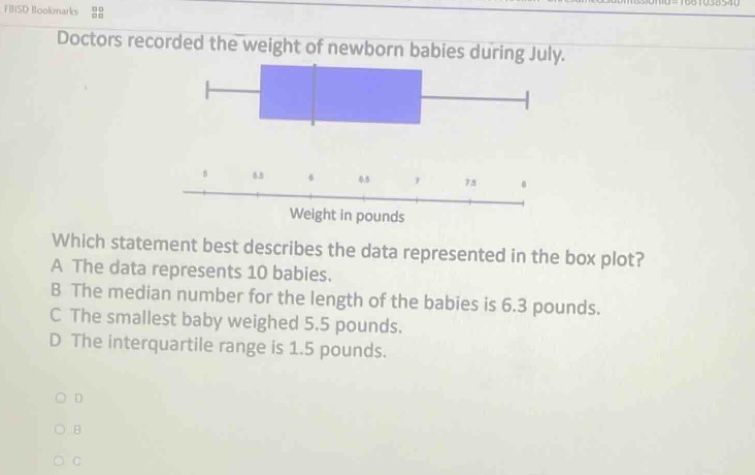
doctors recorded the weight of newborn babies during july. which statement best describes the data represented in the box - plot? a the data represents 10 babies. b the median number for the length of the babies is 6.3 pounds. c the smallest baby weighed 5.5 pounds. d the interquartile range is 1.5 pounds.
Answer
Explanation:
Step1: Recall box - plot concepts
A box - plot shows the five - number summary (minimum, first quartile $Q_1$, median, third quartile $Q_3$, maximum) and the inter - quartile range (IQR = $Q_3 - Q_1$). It does not directly tell the number of data points.
Step2: Analyze option A
The box - plot does not give information about the number of babies. We cannot determine if there are 10 babies from the box - plot alone. So, option A is incorrect.
Step3: Analyze option B
The box - plot is about the weight of babies, not the length. Also, the median value is not 6.3 pounds from the box - plot. So, option B is incorrect.
Step4: Analyze option C
The minimum value (left - most end of the whisker) is not 5.5 pounds. So, option C is incorrect.
Step5: Analyze option D
The first quartile $Q_1$ is approximately 6 pounds and the third quartile $Q_3$ is approximately 7.5 pounds. The inter - quartile range $IQR=Q_3 - Q_1=7.5 - 6 = 1.5$ pounds. So, option D is correct.
Answer:
D. The interquartile range is 1.5 pounds.