dominic works at the local swimming pool. he recorded the number of swimmers each day for the past few…
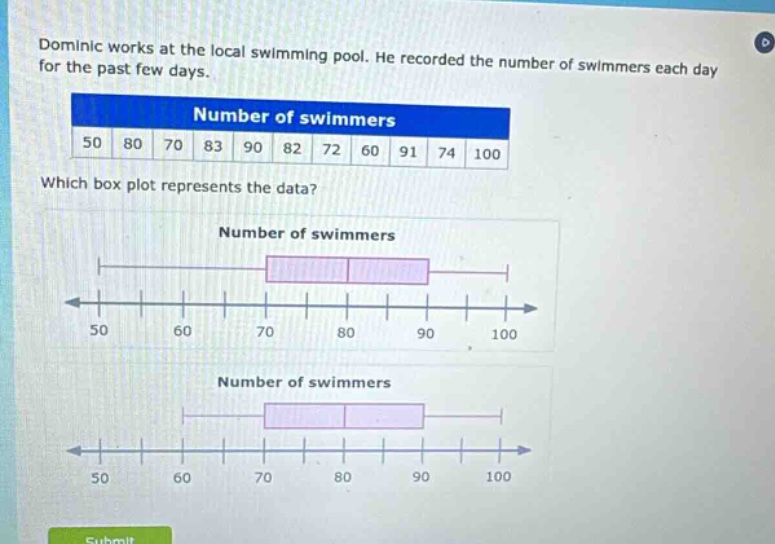
dominic works at the local swimming pool. he recorded the number of swimmers each day for the past few days.\nnumber of swimmers\n50 80 70 83 90 82 72 60 91 74 100\nwhich box plot represents the data?\nnumber of swimmers\n50 60 70 80 90 100\nnumber of swimmers\n50 60 70 80 90 100
Answer
Explanation:
Step1: Arrange data in ascending order
$50,60,70,72,74,80,82,83,90,91,100$
Step2: Find the median (Q2)
There are 11 data - points. The median is the 6th value. So, $Q2 = 80$.
Step3: Find the lower half of data
The lower half is $50,60,70,72,74$. The median of the lower half (Q1) is 70.
Step4: Find the upper half of data
The upper half is $82,83,90,91,100$. The median of the upper half (Q3) is 90.
Step5: Identify the minimum and maximum
The minimum value is 50 and the maximum value is 100.
Step6: Analyze box - plots
A box - plot has a box from Q1 to Q3 with a line at Q2, and whiskers from the minimum to Q1 and from Q3 to the maximum. The correct box - plot should have a box from 70 to 90 with a line at 80, and whiskers starting at 50 and ending at 100.
Answer:
The box - plot with a box starting at 70, ending at 90, a line inside the box at 80, and whiskers starting at 50 and ending at 100.