each dot in the following dot plot represents the number of chocolate chips in one cookie in a package. find…
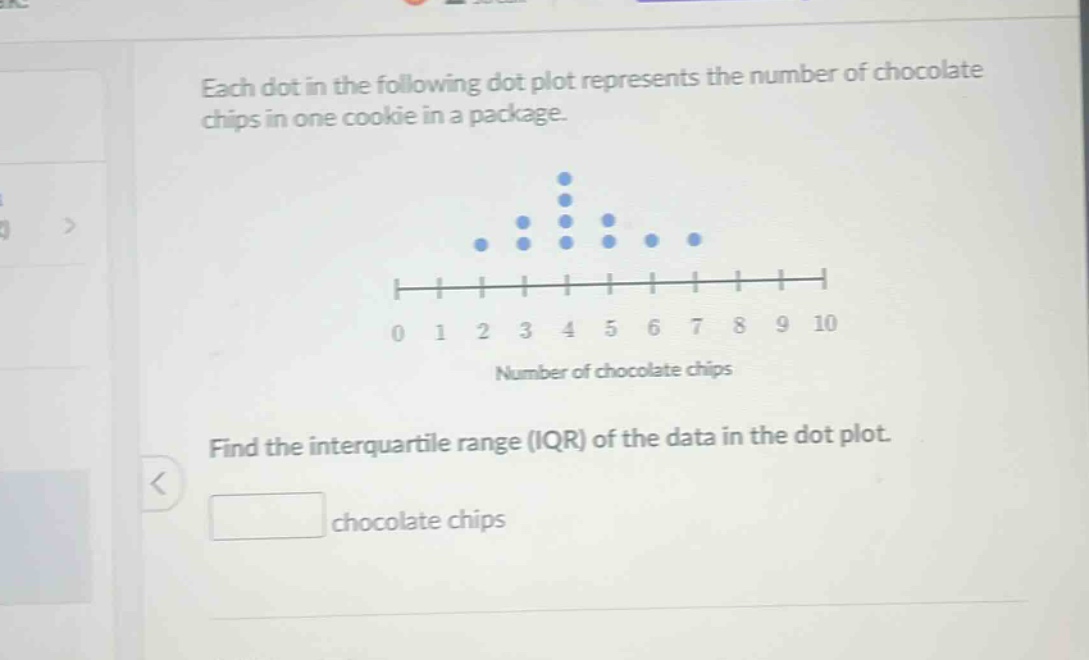
each dot in the following dot plot represents the number of chocolate chips in one cookie in a package. find the interquartile range (iqr) of the data in the dot plot. chocolate chips
Answer
Explanation:
Step1: Count the data points
There are 1 + 1+ 3 + 4+ 3+ 2+ 1 = 15 data - points.
Step2: Find the median (Q2)
Since there are 15 data - points, the median is the 8th value when the data is ordered. Counting from the left, the median (Q2) is 5.
Step3: Find the lower half and Q1
The lower half of the data consists of the first 7 values. The median of the lower half (Q1) is the 4th value. Counting from the left in the lower - half data, Q1 = 3.
Step4: Find the upper half and Q3
The upper half of the data consists of the last 7 values. The median of the upper half (Q3) is the 4th value in the upper - half. Counting from the 9th value, Q3 = 7.
Step5: Calculate the IQR
The inter - quartile range (IQR) is calculated as IQR = Q3 - Q1. So, IQR = 7 - 3 = 4.
Answer:
4