the dot - plot below displays the difference in scores for 18 games between a high school soccer team and…
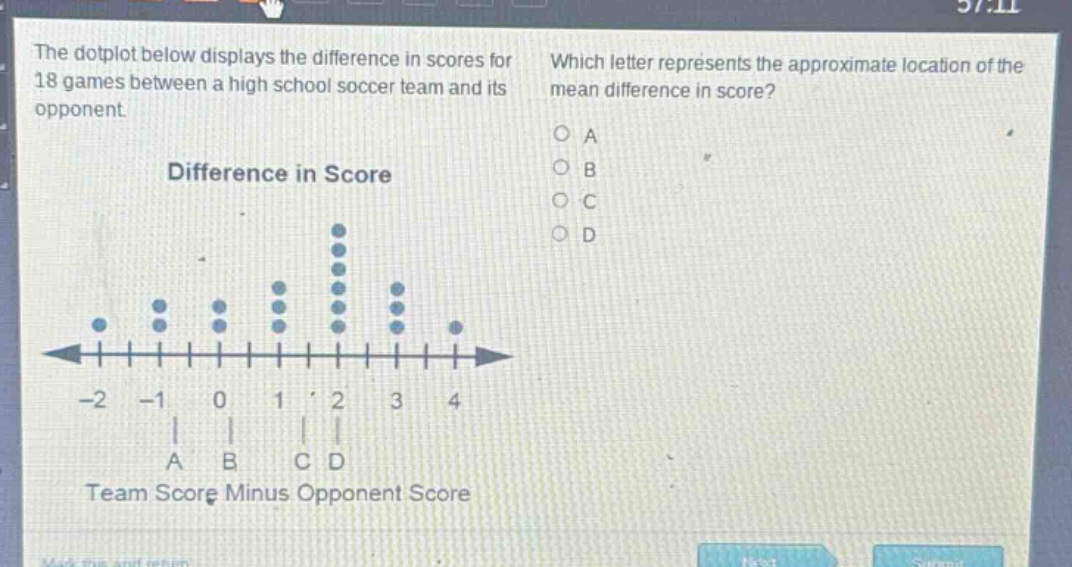
the dot - plot below displays the difference in scores for 18 games between a high school soccer team and its opponent. which letter represents the approximate location of the mean difference in score? difference in score -2 -1 0 1 2 3 4 a b c d team score minus opponent score
Answer
Explanation:
Step1: Count number of dots per value
-2 has 1 dot, -1 has 2 dots, 0 has 2 dots, 1 has 3 dots, 2 has 7 dots, 3 has 3 dots, 4 has 1 dot.
Step2: Calculate sum of products
[(-2\times1)+(-1\times2)+(0\times2)+(1\times3)+(2\times7)+(3\times3)+(4\times1)= - 2-2 + 0+3 + 14+9 + 4=26]
Step3: Calculate mean
Total number of games (n = 18). Mean (\bar{x}=\frac{26}{18}\approx1.44)
Answer:
C