the dot - plot below displays the difference in scores for 18 games between a high school soccer team and…
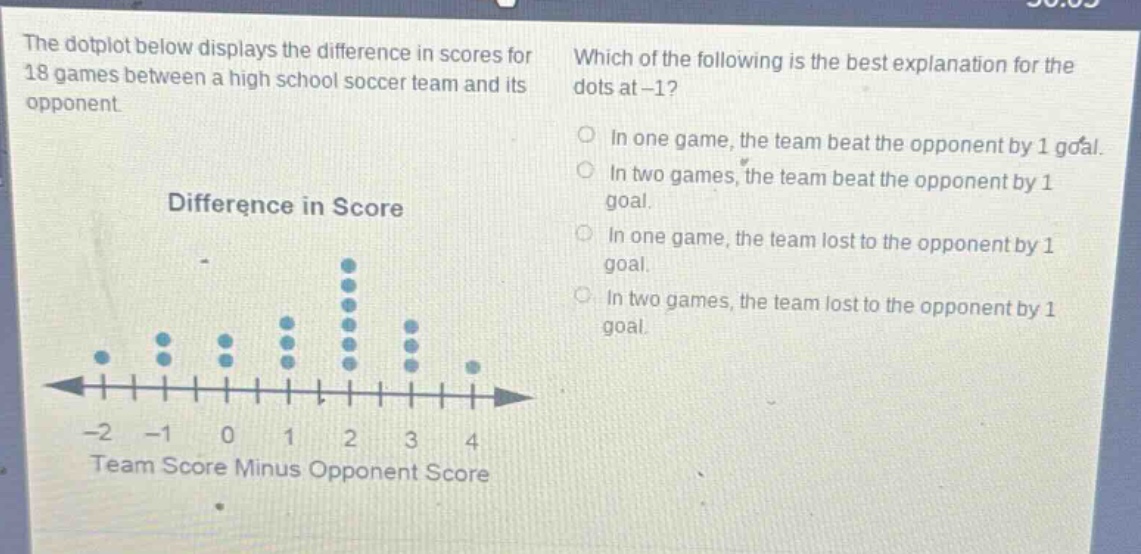
the dot - plot below displays the difference in scores for 18 games between a high school soccer team and its opponent. which of the following is the best explanation for the dots at - 1? in one game, the team beat the opponent by 1 goal. in two games, the team beat the opponent by 1 goal. in one game, the team lost to the opponent by 1 goal. in two games, the team lost to the opponent by 1 goal. difference in score - 2 - 1 0 1 2 3 4 team score minus opponent score
Answer
Brief Explanations:
The dot - plot shows the difference in scores (team score minus opponent score). A value of - 1 for the difference means the opponent's score is 1 more than the team's score, i.e., the team lost to the opponent by 1 goal. There are two dots at - 1, so in two games, the team lost to the opponent by 1 goal.
Answer:
D. In two games, the team lost to the opponent by 1 goal.