the dot - plot below displays the number of math classes taken by a random sample of 35 students at a high…
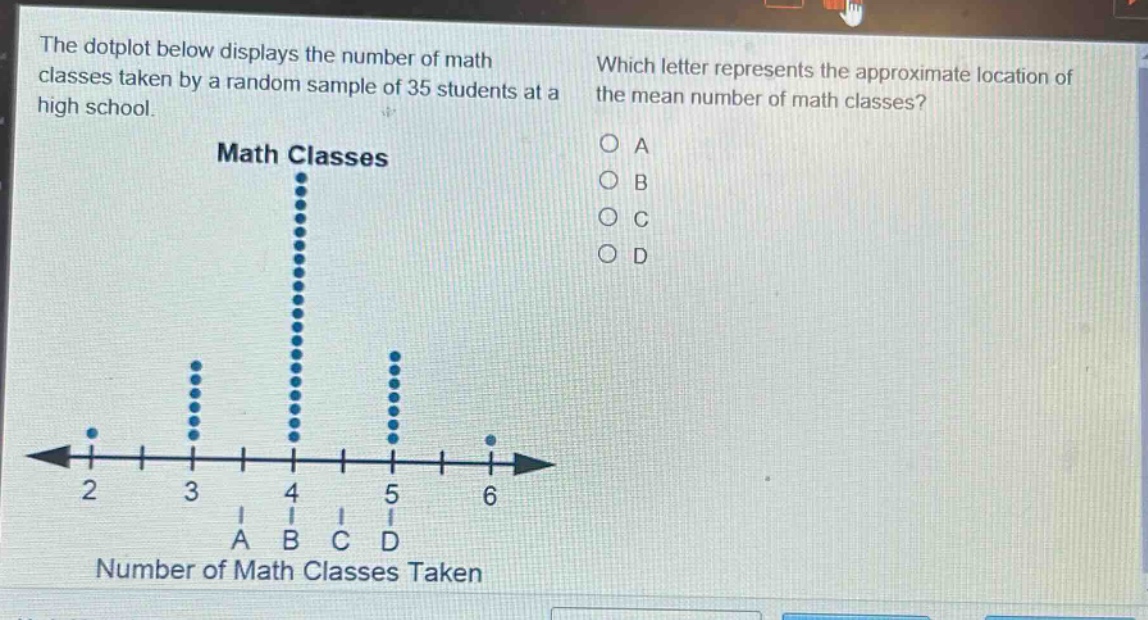
the dot - plot below displays the number of math classes taken by a random sample of 35 students at a high school. which letter represents the approximate location of the mean number of math classes? math classes 2 3 4 5 6 a b c d number of math classes taken
Answer
Answer:
C.
Explanation:
Step1: Recall mean formula
The mean $\bar{x}=\frac{\sum_{i = 1}^{n}x_{i}f_{i}}{\sum_{i = 1}^{n}f_{i}}$, where $x_{i}$ is the value and $f_{i}$ is the frequency.
Step2: Estimate from dot - plot
There is 1 dot at 2, 5 dots at 3, 20 dots at 4, 7 dots at 5 and 2 dots at 6. The sum of frequencies $n=1 + 5+20 + 7+2=35$. The sum $\sum_{i = 1}^{n}x_{i}f_{i}=2\times1+3\times5 + 4\times20+5\times7+6\times2=2 + 15+80+35 + 12=144$. So the mean $\bar{x}=\frac{144}{35}\approx4.11$. Since 4.11 is closest to the value at point C on the dot - plot, the answer is C.