the dot - plot below displays the number of math classes taken by a random sample of students at a high…
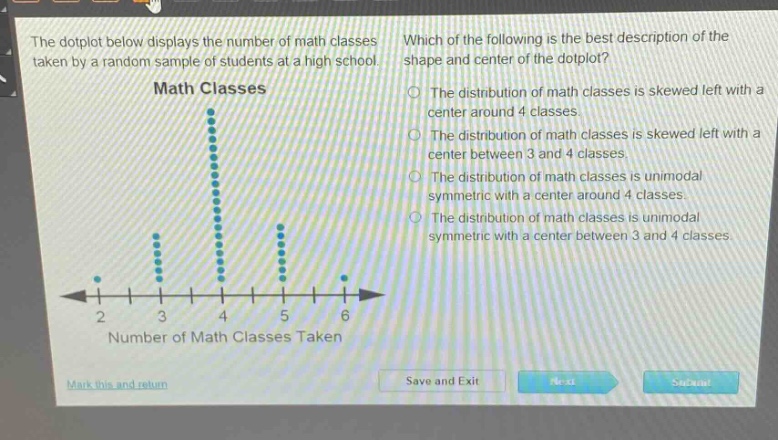
the dot - plot below displays the number of math classes taken by a random sample of students at a high school. which of the following is the best description of the shape and center of the dot - plot? math classes the distribution of math classes is skewed left with a center around 4 classes. the distribution of math classes is skewed left with a center between 3 and 4 classes. the distribution of math classes is unimodal symmetric with a center around 4 classes. the distribution of math classes is unimodal symmetric with a center between 3 and 4 classes. 2 3 4 5 6 number of math classes taken
Answer
Explanation:
Step1: Analyze the shape
The dot - plot has a single peak (unimodal) and the left and right sides are approximately mirror - images of each other, so it is symmetric.
Step2: Determine the center
Most of the data is clustered around 4. The center of the distribution is around 4 classes.
Answer:
The distribution of math classes is unimodal symmetric with a center around 4 classes.