the dot plot below represents how long it takes students in a 7th grade math class to get to school every…
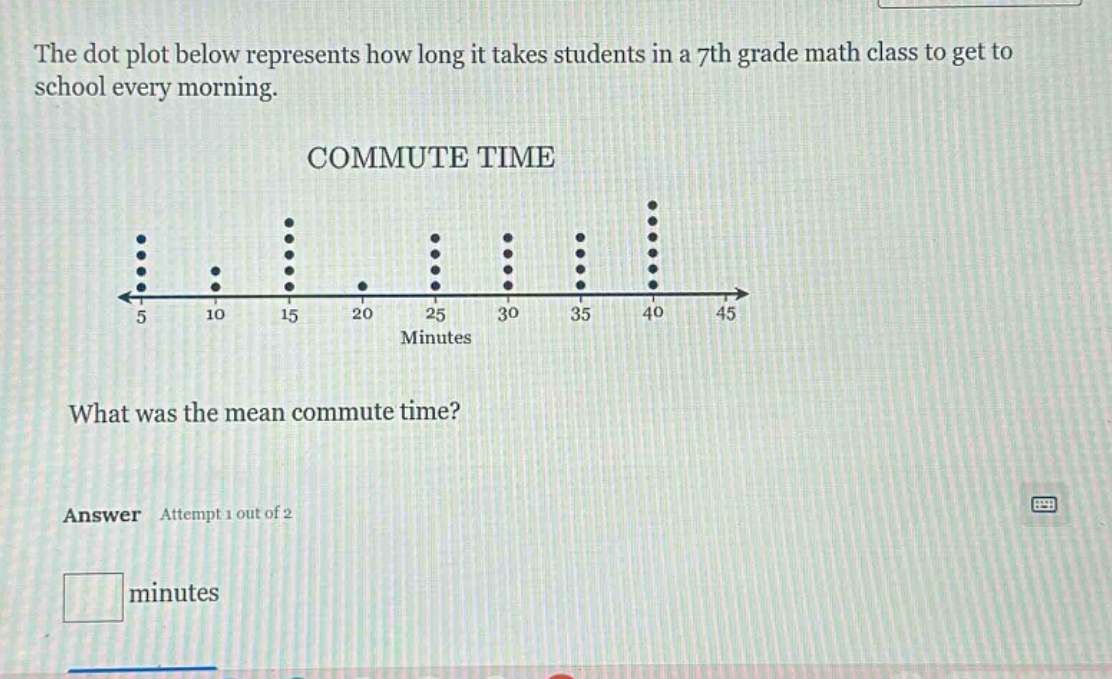
the dot plot below represents how long it takes students in a 7th grade math class to get to school every morning. commute time what was the mean commute time? answer attempt 1 out of 2 minutes
Answer
Explanation:
Step1: Count number of dots per value
5 minutes: 4 dots; 10 minutes: 1 dot; 15 minutes: 6 dots; 20 minutes: 1 dot; 25 minutes: 3 dots; 30 minutes: 3 dots; 35 minutes: 3 dots; 40 minutes: 7 dots.
Step2: Calculate sum of (value * frequency)
$(5\times4)+(10\times1)+(15\times6)+(20\times1)+(25\times3)+(30\times3)+(35\times3)+(40\times7)=20 + 10+90 + 20+75+90+105+280 = 790$.
Step3: Calculate total number of data - points
$4 + 1+6 + 1+3+3+3+7=28$.
Step4: Calculate the mean
Mean = $\frac{790}{28}\approx28.21$
Answer:
$28.21$