the dot plot below represents how long it takes students in a 7th grade math class to get to school every…
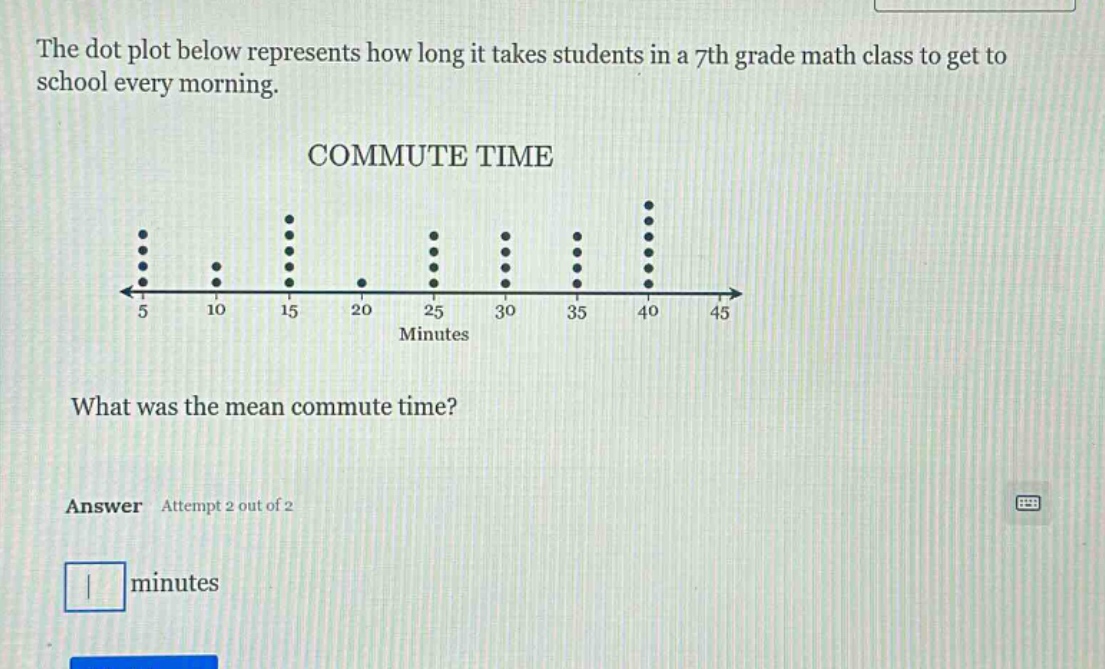
the dot plot below represents how long it takes students in a 7th grade math class to get to school every morning. commute time what was the mean commute time? answer attempt 2 out of 2 minutes
Answer
Explanation:
Step1: Count the number of data - points at each value
There are 5 dots at 5 minutes, 2 dots at 10 minutes, 7 dots at 15 minutes, 1 dot at 20 minutes, 4 dots at 25 minutes, 3 dots at 30 minutes, 3 dots at 35 minutes, and 6 dots at 40 minutes.
Step2: Calculate the sum of the products of each value and its frequency
[ \begin{align*} &(5\times5)+(10\times2)+(15\times7)+(20\times1)+(25\times4)+(30\times3)+(35\times3)+(40\times6)\ =&25 + 20+105 + 20+100+90+105+240\ =&705 \end{align*} ]
Step3: Calculate the total number of data - points
[5 + 2+7 + 1+4+3+3+6=31]
Step4: Calculate the mean
The mean $\bar{x}=\frac{705}{31}\approx22.74$
Answer:
$22.74$