the dot plot below represents how long it takes students in an 8th grade math class to get to school every…
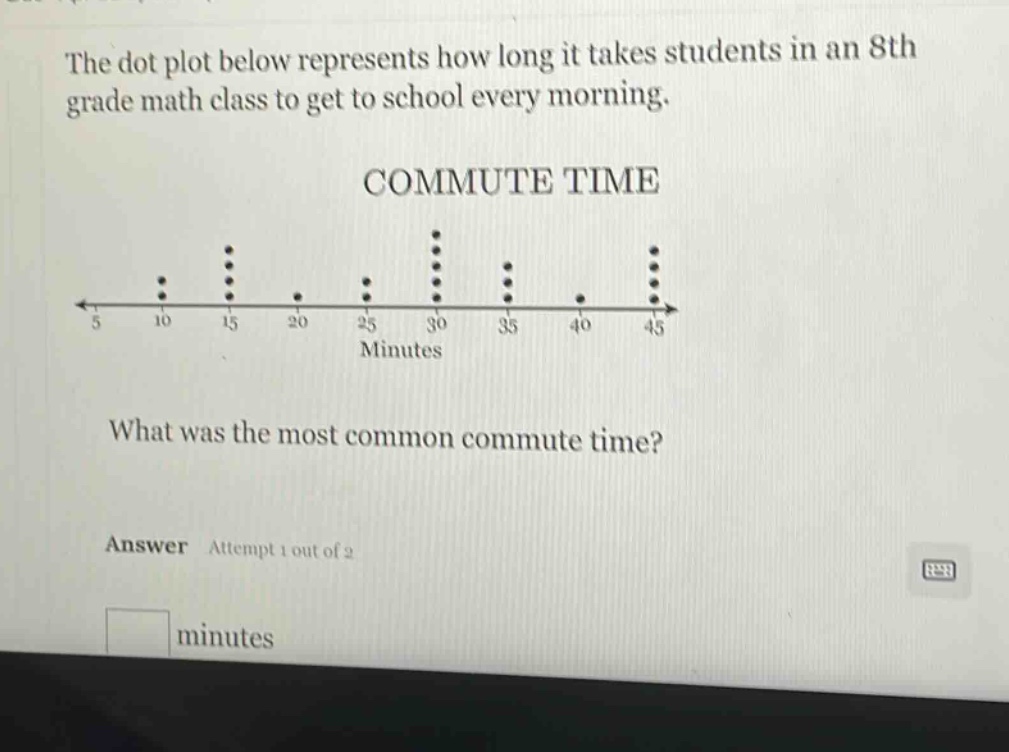
the dot plot below represents how long it takes students in an 8th grade math class to get to school every morning. commute time what was the most common commute time? answer attempt 1 out of 2 minutes
Answer
Answer:
45
Explanation:
Step1: Identify mode concept
The most common value is the mode.
Step2: Count dot - frequencies
Count dots for each time value.
Step3: Determine highest frequency
45 minutes has the most dots.