the dot plot shows the ages of quiz show contestants. 2. what is the median of the data? a 21 b 21.5 c 22 d 25
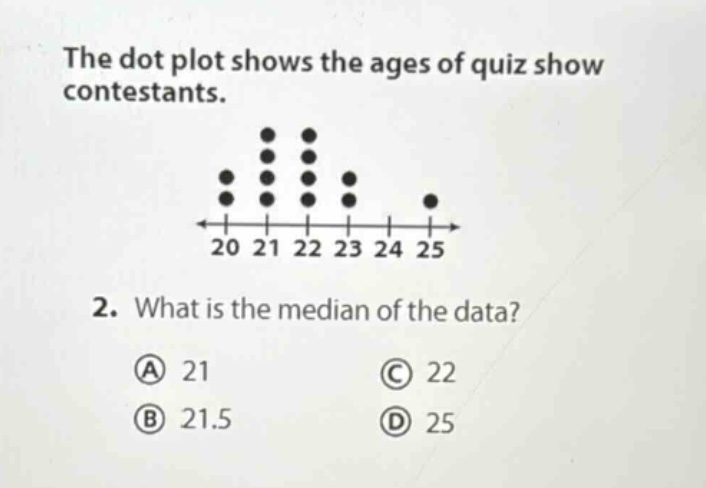
the dot plot shows the ages of quiz show contestants. 2. what is the median of the data? a 21 b 21.5 c 22 d 25
Answer
Explanation:
Step1: Count the total number of data - points
Count the number of dots. There are 3 + 5+ 5 + 2+ 1=16 data - points.
Step2: Determine the position of the median
Since (n = 16) (an even number), the median is the average of the (\frac{n}{2})th and ((\frac{n}{2}+ 1))th ordered data - points. (\frac{n}{2}=\frac{16}{2}=8) and (\frac{n}{2}+1 = 9).
Step3: Arrange the data and find the median
Arrange the data in ascending order. The 8th and 9th ordered data - points are both 22. The median is (\frac{22 + 22}{2}=22).
Answer:
C. 22