the dot plot shows how much hairdressers in margots area charge for a womans haircut. the least expensive…
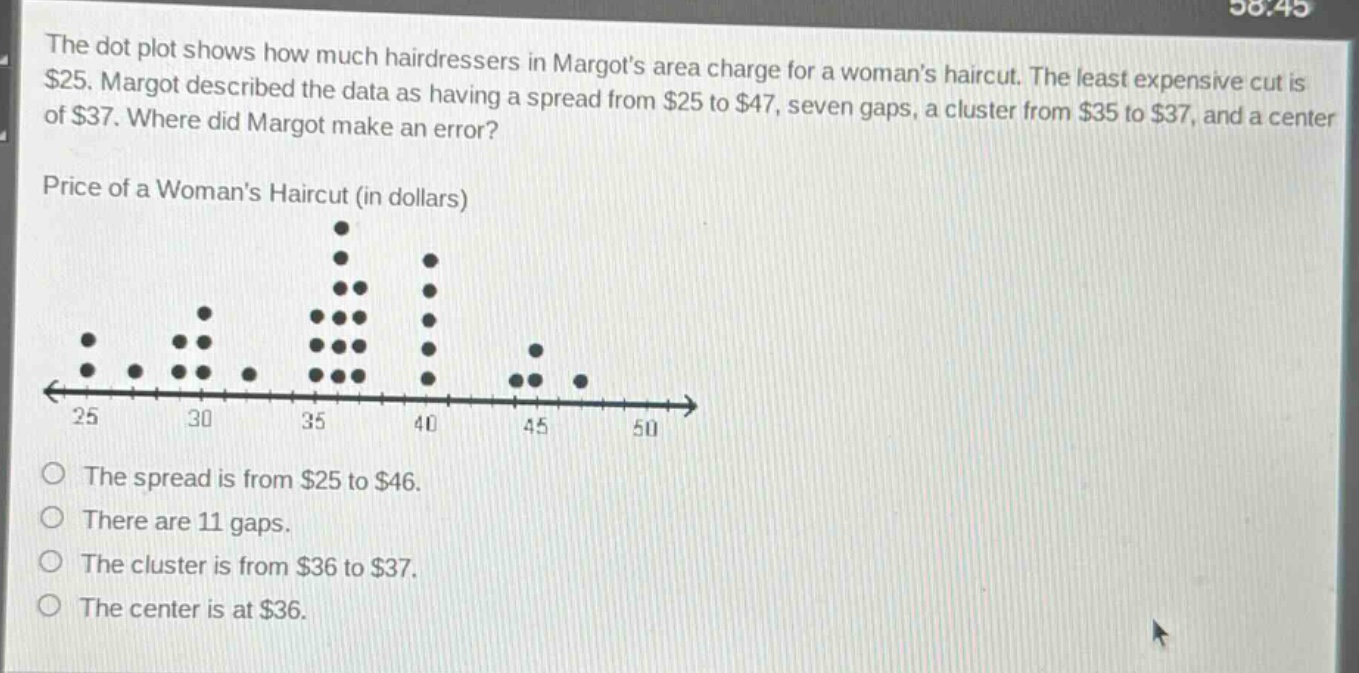
the dot plot shows how much hairdressers in margots area charge for a womans haircut. the least expensive cut is $25. margot described the data as having a spread from $25 to $47, seven gaps, a cluster from $35 to $37, and a center of $37. where did margot make an error?\nprice of a womans haircut (in dollars)\n\nthe spread is from $25 to $46.\nthere are 11 gaps.\nthe cluster is from $36 to $37.\nthe center is at $36.
Answer
Explanation:
Step1: Identify the maximum value
By looking at the dot - plot, the maximum value of the data set (highest price of a woman's haircut) is $46.
Step2: Analyze Margot's statement about spread
Margot said the spread is from $25$ to $47$, but since the maximum value is $46$, the spread is actually from $25$ to $46$.
Answer:
The spread is from $25$ to $46$.