the dot plot shows the number of books each student reads during a summer reading program. what is the range…
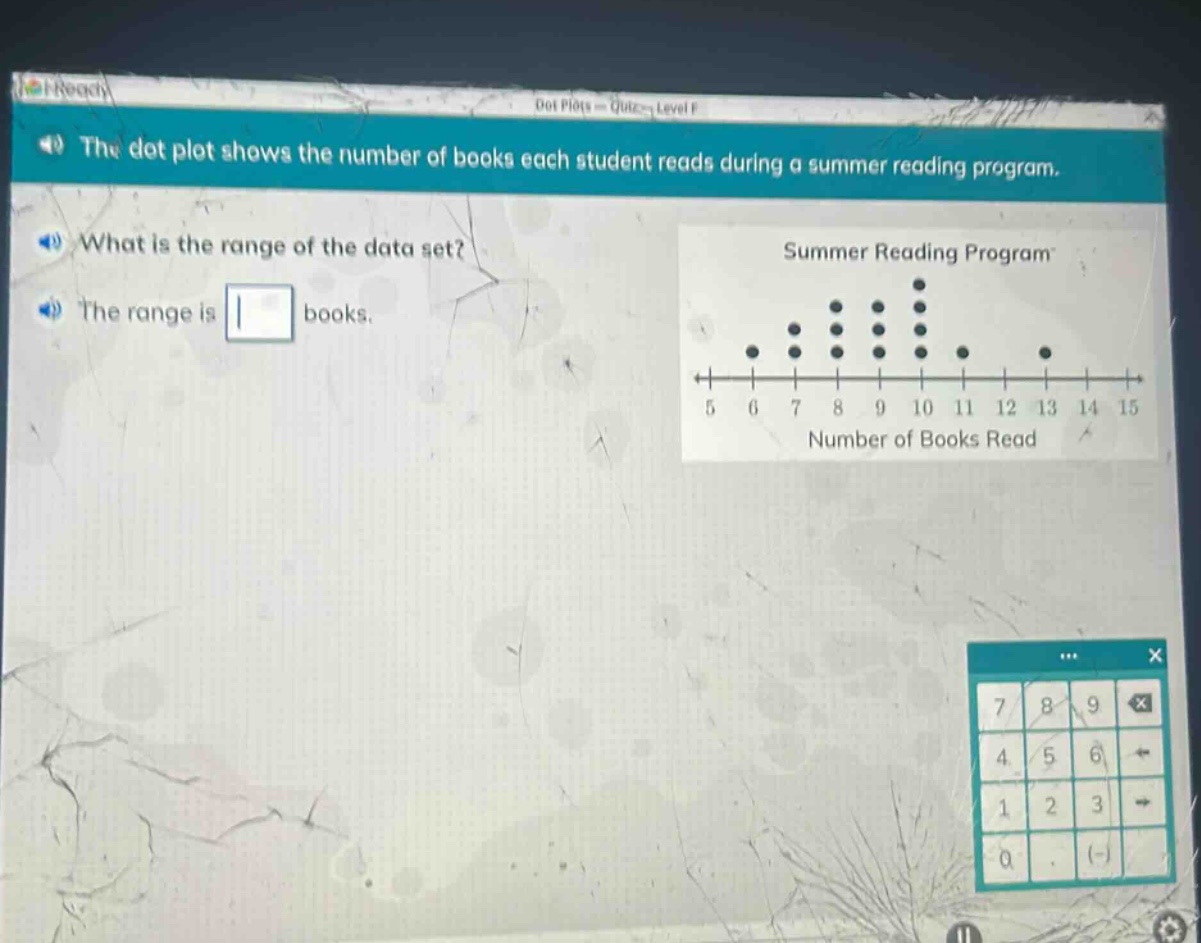
the dot plot shows the number of books each student reads during a summer reading program. what is the range of the data set? the range is books.
Answer
Explanation:
Step1: Identify max value
The maximum number of books read is 14.
Step2: Identify min value
The minimum number of books read is 6.
Step3: Calculate range
Range = Max - Min = 14 - 6
Answer:
8