the dot plot shows the number of cupcakes bought by each person who came to a bake sale. number of cupcakes…
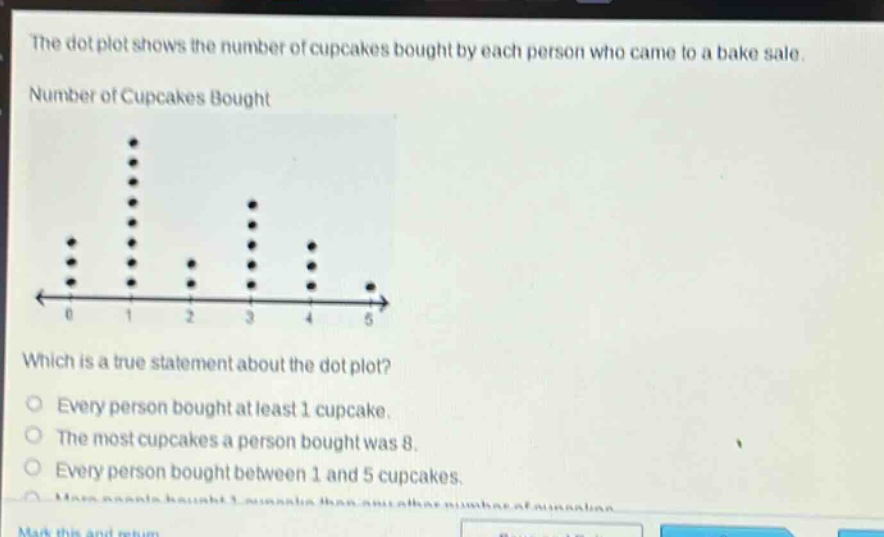
the dot plot shows the number of cupcakes bought by each person who came to a bake sale. number of cupcakes bought which is a true statement about the dot plot? every person bought at least 1 cupcake. the most cupcakes a person bought was 8. every person bought between 1 and 5 cupcakes.
Answer
Explanation:
Step1: Analyze the dot - plot
The dot - plot has dots above 0, 1, 2, 3, 4, and 5 on the number of cupcakes axis.
Step2: Evaluate each option
- Option 1: There are dots above 0, so not every person bought at least 1 cupcake.
- Option 2: The highest value on the number of cupcakes axis is 5, not 8.
- Option 3: There are dots above 0, so not every person bought between 1 and 5 cupcakes.
- Option 4: The most dots are above 1, which means more people bought 1 cupcake than any other number of cupcakes.