the dot plot shows the number of emails aaron sent his cousin each week. number of emails each week where is…
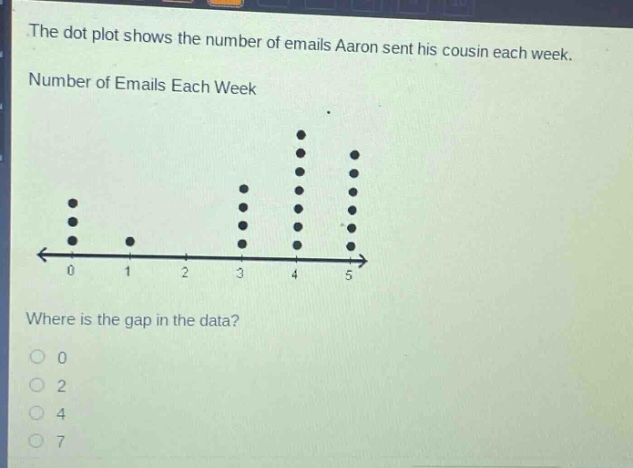
the dot plot shows the number of emails aaron sent his cousin each week. number of emails each week where is the gap in the data? 0 2 4 7
Answer
Explanation:
Step1: Understand the dot - plot
A dot - plot shows the frequency of data values. Each dot represents a data point.
Step2: Identify the data values with no dots
We look for the number on the number line where there are no dots. The numbers of emails are 0, 1, 3, 4, 5. There are no dots above 2.
Answer:
2