the dot plot shows the number of participants in each age group in a science fair. which of the following is…
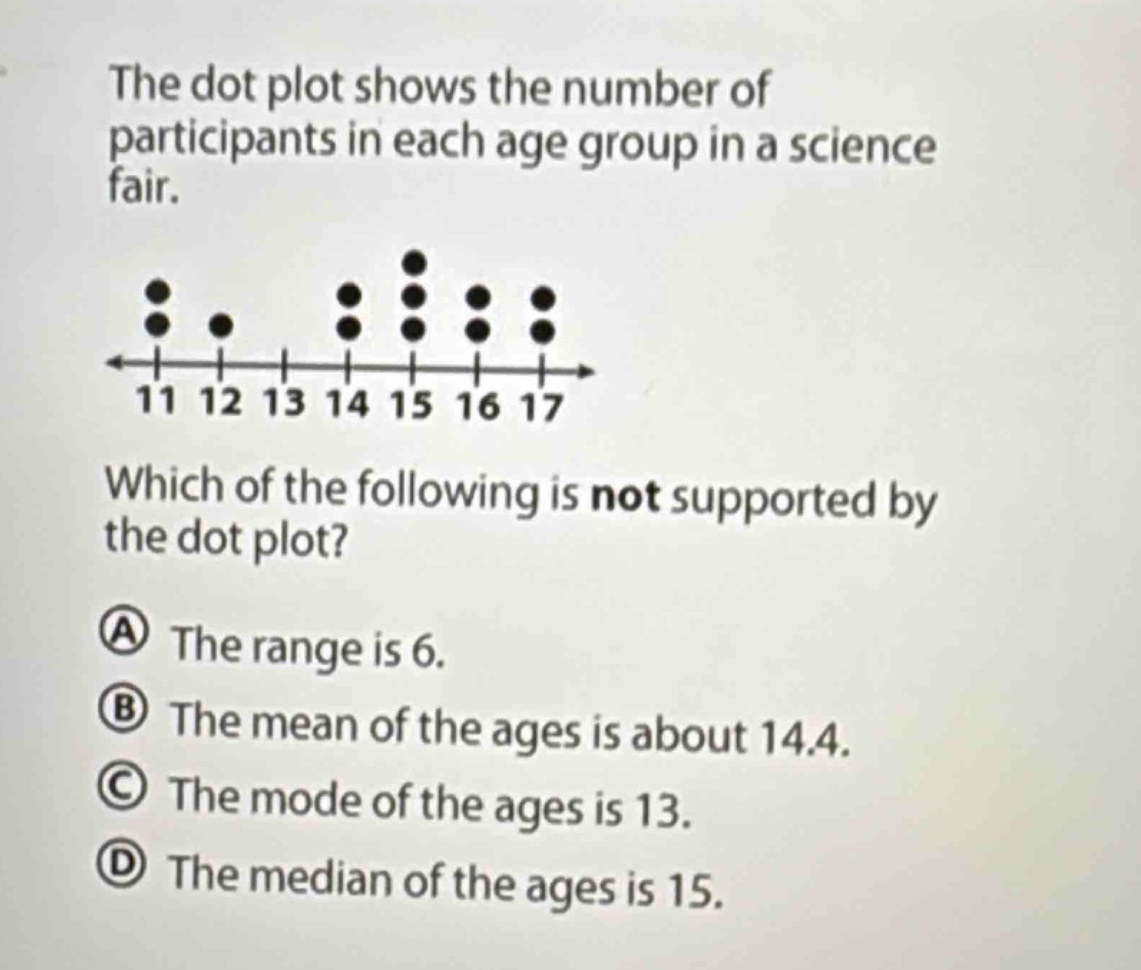
the dot plot shows the number of participants in each age group in a science fair. which of the following is not supported by the dot plot? a the range is 6. b the mean of the ages is about 14.4. c the mode of the ages is 13. d the median of the ages is 15.