the dot plot shows the number of participants in each age group in a science fair. which of the following is…
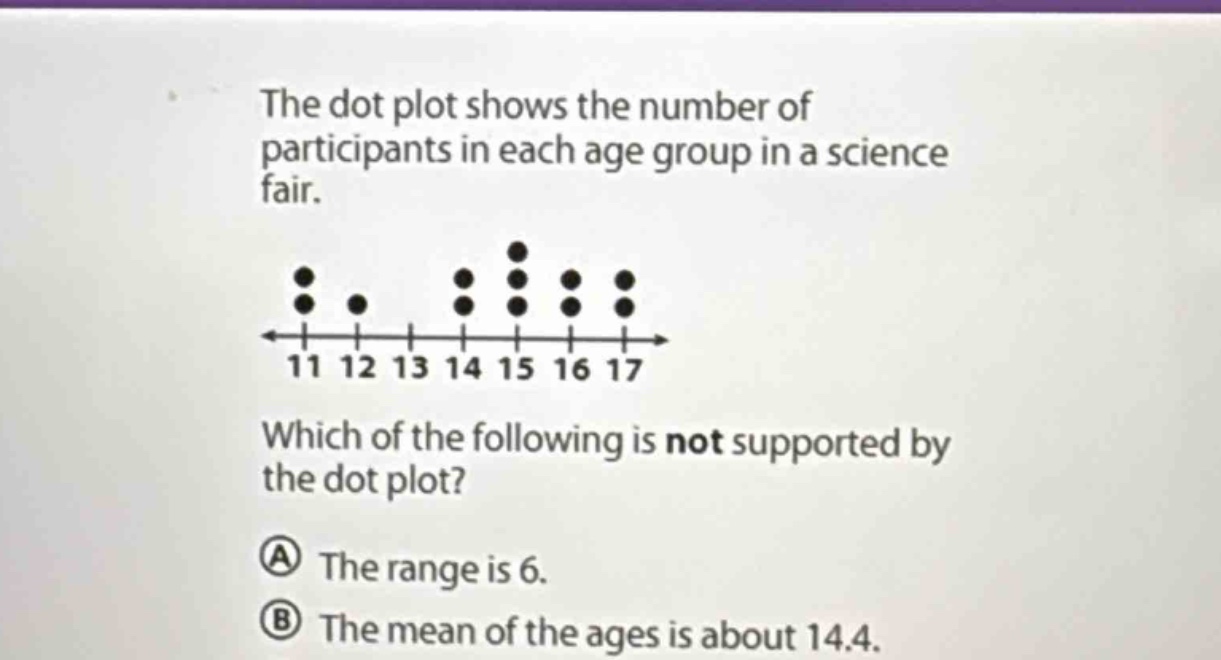
the dot plot shows the number of participants in each age group in a science fair. which of the following is not supported by the dot plot? a the range is 6. b the mean of the ages is about 14.4.
Answer
Explanation:
Step1: Calculate the range
The range is the difference between the maximum and minimum values. The maximum value is 17 and the minimum value is 11. So the range is $17 - 11=6$.
Step2: Calculate the mean
There are 2 participants of age 11, 1 of age 12, 0 of age 13, 2 of age 14, 3 of age 15, 2 of[Client Connection Error]