the dot plot shows the number of words students spelled correctly on a pre - test. which statement best…
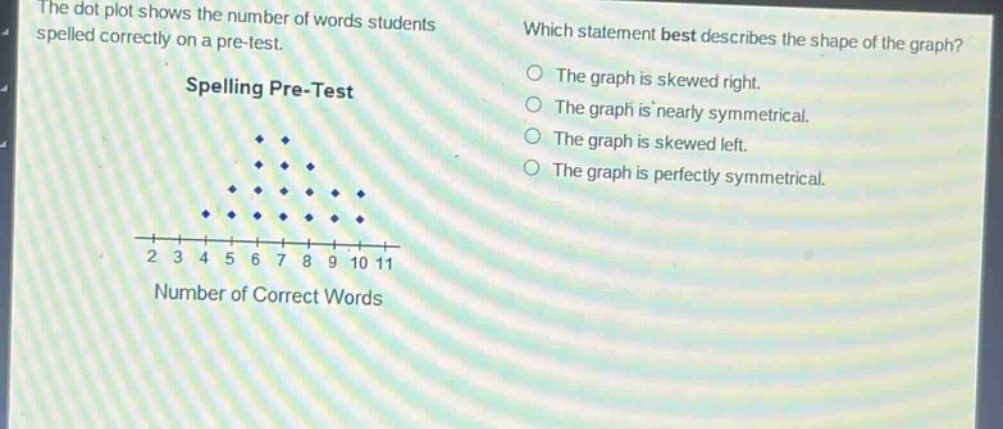
the dot plot shows the number of words students spelled correctly on a pre - test. which statement best describes the shape of the graph? spelling pre - test the graph is skewed right. the graph is nearly symmetrical. the graph is skewed left. the graph is perfectly symmetrical. 2 3 4 5 6 7 8 9 10 11 number of correct words
Answer
Brief Explanations:
Examine the dot - plot. The left and right sides of the distribution of dots are not mirror - images (so not perfectly symmetrical), but they are relatively similar in shape. The data is not pulled more to the left or right. So, it is nearly symmetrical.
Answer:
The graph is nearly symmetrical.